MAE and MFE: What Happened Inside Your Trade?
Last saved:
Executive Summary
- ✦MAE measures the largest adverse move; MFE measures the largest favourable move.
- ✦Express excursions in initial R to compare different trades.
- ✦Review distributions by setup and regime rather than one anecdote.
- ✦Test rule changes on a larger unseen sample before using them live.
Learning objective: measure maximum adverse excursion (MAE) and maximum favourable excursion (MFE), then use a series of trades to improve entries, stops and exits without fitting rules to one result.
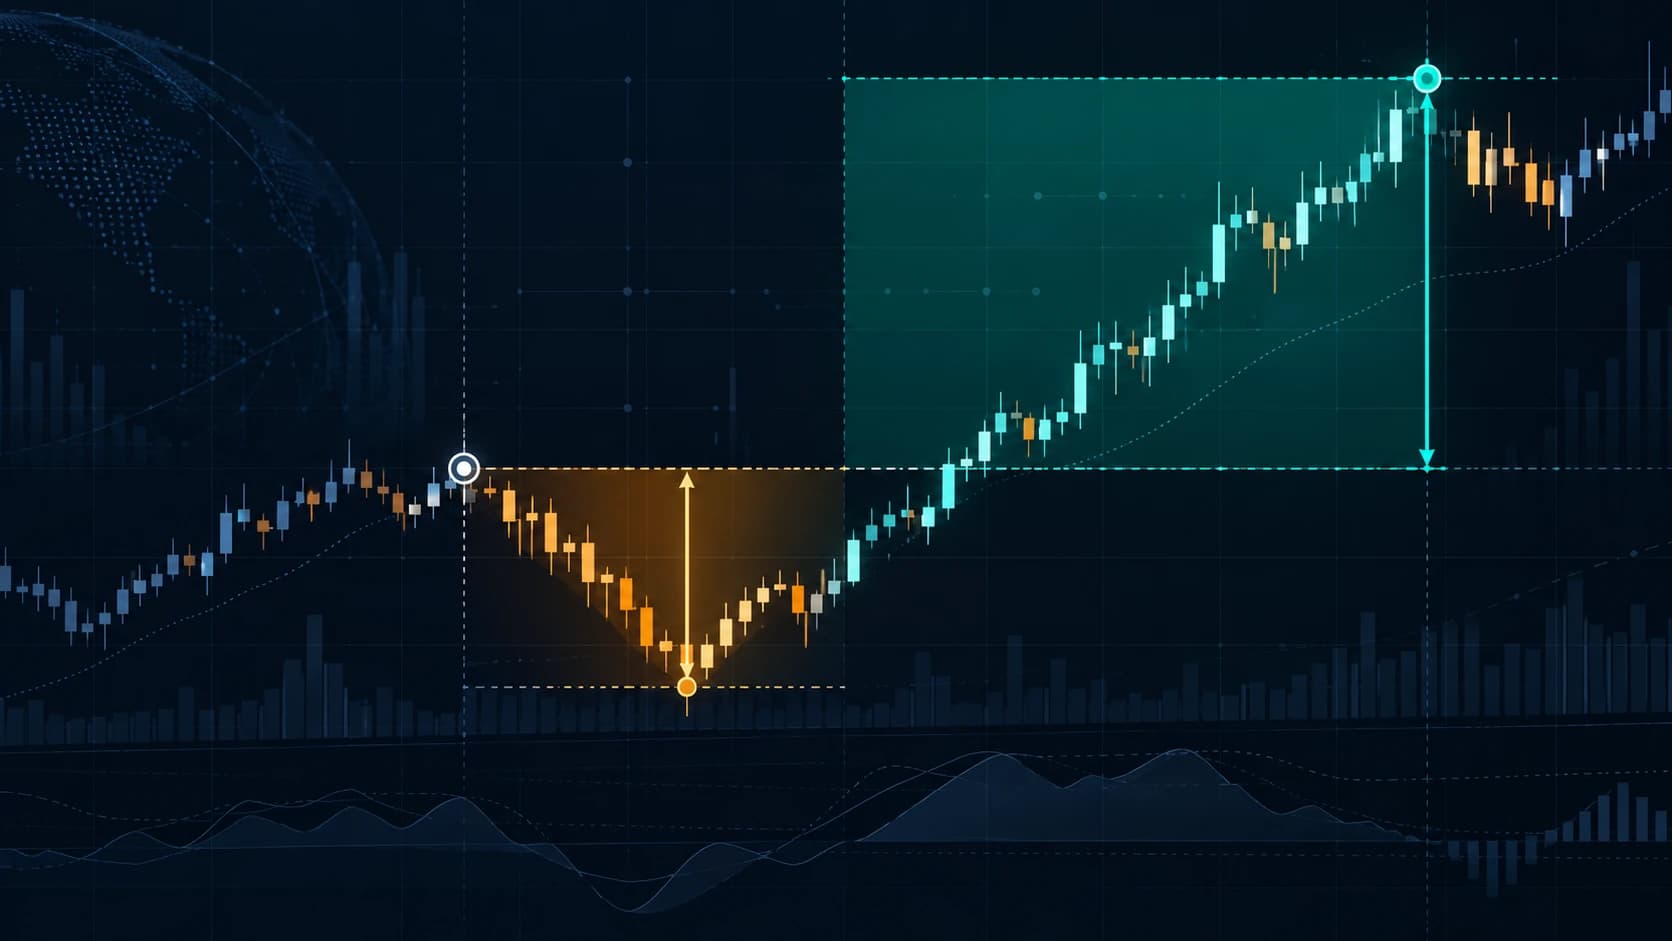
The final profit or loss hides the path a trade travelled. A winning trade may have nearly hit its stop first. A losing trade may have shown a large open profit before reversing. MAE and MFE preserve that path.
- MAE is the largest unrealised move against the position while it was open.
- MFE is the largest unrealised move in favour of the position while it was open.
Both can be recorded in money, percentage, price points or R-multiples. R usually makes comparison across different sizes easier.
1. Fix the measurement window
Measure from the actual entry until the actual exit. For a long trade, MAE uses the lowest traded price during the holding period and MFE uses the highest. For a short trade, the calculation is reversed.
Use data that matches the strategy. Daily bars may be enough for end-of-day swing trading, but they cannot show the order of the intraday high and low. A strategy managed intraday needs intraday data.
2. Convert excursions into R
Suppose a long entry is £50, the initial stop is £48 and the risk distance is £2. One R equals £2 per share.
If price falls to £49.20 before rising, MAE is £0.80, or 0.4R. If it later reaches £54 before exit, MFE is £4, or 2R. An exit at £52.50 realises +1.25R, meaning 0.75R of the best unrealised gain was not captured.
That difference is information, but not automatically a mistake. A trend-following exit will never capture every high.
3. Review distributions, not anecdotes
Across a meaningful sample, ask:
- How much MAE do winning trades usually experience?
- Do many losers show little or no MFE?
- How much of MFE is typically converted into realised R?
- Do results change by setup, asset or volatility regime?
If most winners stay within 0.5R adverse movement while the stop is 1R away, the entry or stop may deserve investigation. It does not prove the stop should immediately be tightened. A tighter stop changes which trades survive and must be retested.
4. Use MAE and MFE to ask better questions
High MAE among winners may indicate early entries, volatile instruments or stops placed inside normal noise. High MFE followed by weak realised results may point to an exit rule that returns too much open profit. Very low MFE on losers can show setups that fail quickly and may benefit from a time stop.
Costs, gaps and liquidity still matter. Excursion data describes past paths; it cannot guarantee that future trades behave the same way.
Worked example
Five similar breakout trades show the following results:
| Trade | MAE | MFE | Realised |
|---|---|---|---|
| A | 0.2R | 2.4R | 1.8R |
| B | 0.4R | 1.9R | 1.2R |
| C | 1.0R | 0.1R | -1.0R |
| D | 0.3R | 2.1R | 0.6R |
| E | 0.9R | 0.2R | -0.9R |
The two losses showed almost no favourable movement, while winners stayed within 0.4R MAE. Trade D gave back 1.5R from its best point. A trader might test two hypotheses on a larger historical sample: an earlier failure rule for trades with no progress, and a trailing method that protects more profit after MFE exceeds 2R.
The correct next step is testing, not changing live rules from five observations.
Common mistakes
- Measuring from planned entry instead of actual fill.
- Using daily bars for a strategy managed intraday.
- Treating every gap between MFE and realised profit as failure.
- Tightening stops from a small sample and creating curve-fit rules.
- Mixing long and short setups or different regimes without labels.
- Ignoring fees, slippage and partial exits.
Practical checklist
- Are entry, exit, high and low taken from consistent data?
- Is the direction of the trade handled correctly?
- Are MAE and MFE expressed in initial R?
- Are actual fills and costs recorded?
- Is the sample separated by setup and regime?
- What does the distribution show, rather than one trade?
- Is a proposed rule change retested on unseen data?
- Could the change reduce winners as well as losses?
The Money Man view
MAE and MFE are diagnostic tools. They reveal whether risk came before reward and how much open profit a method retained. We use them to form testable hypotheses, while keeping the initial risk unit fixed and resisting the temptation to optimise around a handful of trades.
Educational information only. This tutorial is AI-assisted and published by The Money Man. It is not personalised investment advice, a recommendation or a promise of returns. Trading can result in losses.