Moving Averages in Trading: Trend Filter, Signal and Common Traps
Last saved:
Executive Summary
- ✦Choose the calculation, input and timeframe explicitly.
- ✦Give each moving average one defined job.
- ✦Expect lag in trends and whipsaw in ranges.
- ✦Use price structure for confirmation and invalidation.
Moving Averages in Trading: Trend Filter, Signal and Common Traps
Learning objective: use moving averages for a defined purpose, understand their lag and test settings without turning the chart into a search for perfect signals.
A moving average smooths past prices. It can describe trend direction, act as a systematic filter or form part of an entry and exit rule. It cannot predict the next candle, and it does not create support simply because many traders watch it.
1. Choose the calculation
A simple moving average (SMA) gives equal weight to each observation. An exponential moving average (EMA) gives more weight to recent prices and usually reacts faster. Neither is universally better.
The input also matters. Most charts use closing price, but a rule may use typical price or another defined series. Settings must be consistent between research and live use.
2. Give the average one job
Possible jobs include:
- trade only long when price and the average slope are rising;
- identify a pullback zone within an established trend;
- exit after a close beyond the average;
- compare short- and long-term momentum through a crossover.
Do not use the same average as trend filter, exact entry, stop and profit target without testing those separate assumptions.
3. Understand lag and whipsaw
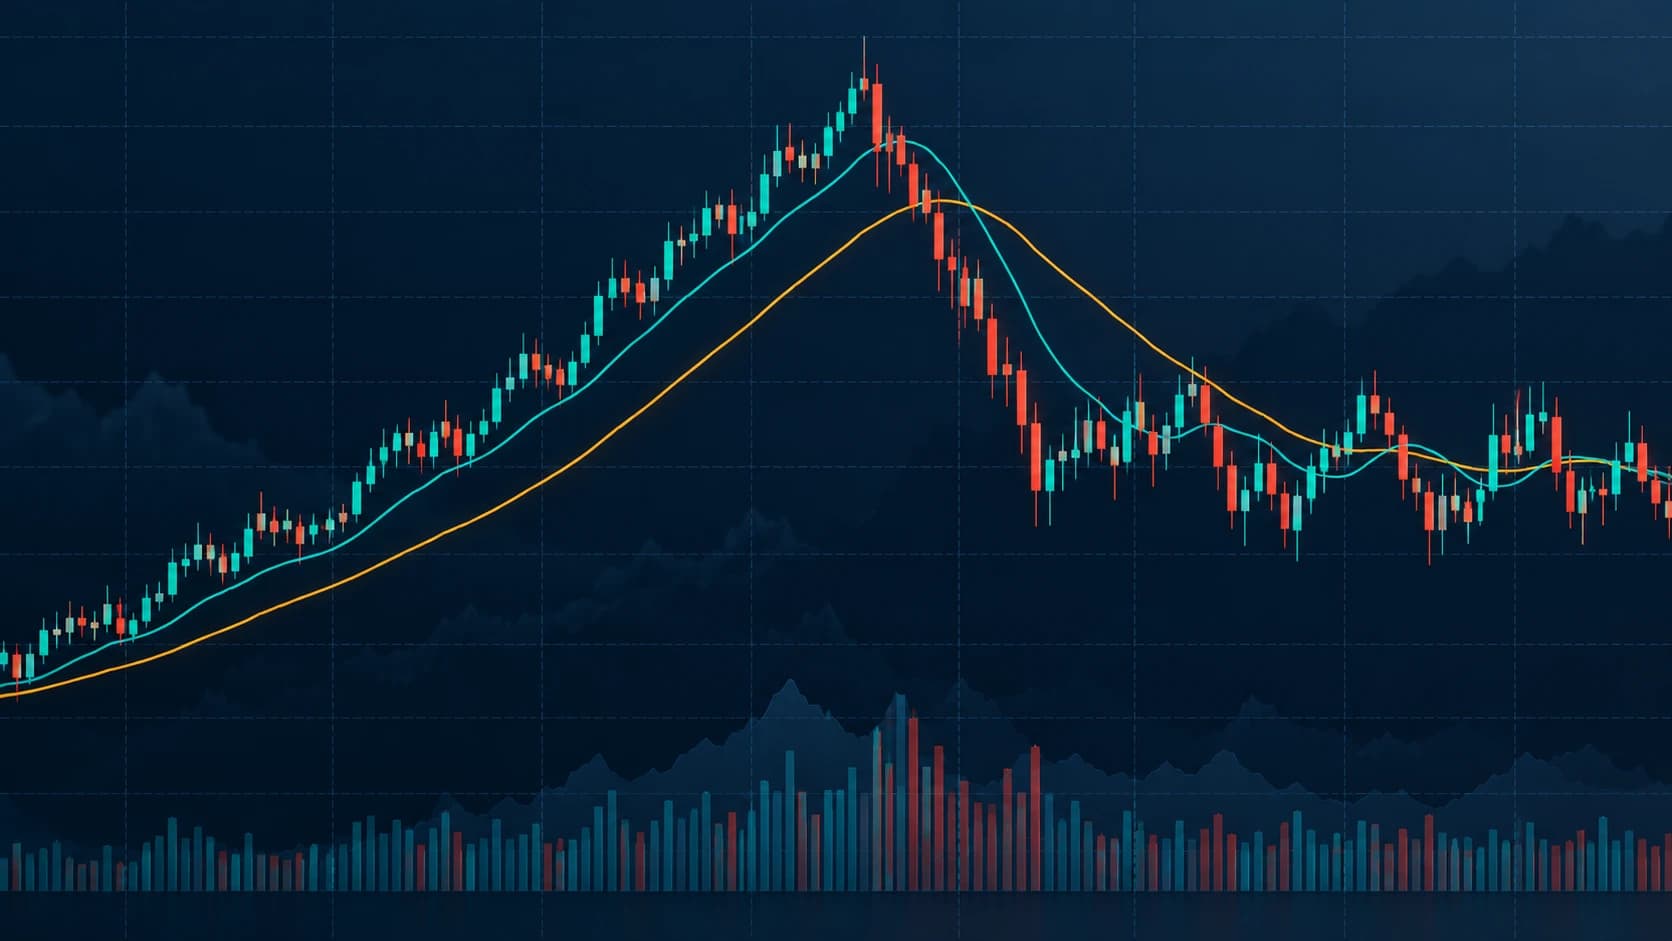
Every moving average uses historical data, so it turns after price. A shorter lookback responds faster but produces more false turns in a range. A longer lookback is smoother but reacts later when a trend changes.
Crossover strategies can work during persistent trends and struggle during sideways markets. The crossover itself does not explain market regime.
4. Combine it with structure and risk
Price may pass through an average repeatedly. Use market structure, volatility and a defined invalidation rather than assuming the line will hold. A volatility buffer may reduce noise but widens the stop and therefore requires a smaller position for the same cash-risk budget.
Worked example
A hypothetical share trades at £82 above a rising 50-day SMA at £78. It pulls back to £79, forms a daily higher low at £77.50 and then closes back above £80.
The strategy uses the rising 50-day SMA as a trend filter, while the higher low supplies structure. Entry is considered at £80.50 with invalidation below £77.30. Risk is £3.20 per share. With an illustrative £320 cash-risk budget, mathematical size is 100 shares before fees and slippage.
If the 50-day SMA is rising but price closes below £77.30, the structure has failed. The average is not a reason to widen the stop. If price moves sideways around the SMA for several weeks, the filter no longer provides a clean trend environment.
Common mistakes
- Optimising a lookback until it fits one historical chart.
- Assuming a crossover predicts price rather than confirms past movement.
- Treating the line as exact support or resistance.
- Mixing daily averages with intraday decisions without a rule.
- Ignoring dividends, adjusted data and contract rolls.
- Adding several similar averages that repeat the same information.
- Changing settings after a small losing sample.
Practical checklist
- Is the average SMA, EMA or another calculation?
- Which price input and timeframe does it use?
- What single job does it perform in the strategy?
- How does the rule behave in trends and ranges?
- What price structure confirms the setup?
- Where is invalidation independent of the line?
- Were costs, gaps and realistic fills tested?
- Does the result persist across instruments and market regimes?
The Money Man view
For daily-timeframe trading, a moving average is most useful as a consistent filter rather than a prediction. Price structure and risk still decide whether a setup is tradable. The analysis is invalid if it treats a lagging line as guaranteed support or keeps changing the lookback until history looks perfect.
This tutorial is educational information prepared with AI-assisted research and writing. It is not personalised financial advice or a trade recommendation. Historical performance does not guarantee future results.