Relative Strength: Is Your Asset Really Outperforming?
Last saved:
Executive Summary
- ✦Relative strength compares an asset with a benchmark; it is not RSI.
- ✦Choose a benchmark that matches the sector, region and currency.
- ✦Combine the ratio trend with the asset’s absolute price trend.
- ✦Use relative strength to rank candidates, then define a price trigger and invalidation.
Learning objective: learn how to compare an asset with a relevant benchmark, read a relative-strength ratio and use it as supporting evidence in a daily-timeframe trading plan.
A share can rise and still be a weak choice if its market rises faster. It can also fall while showing resilience when its sector or benchmark falls more sharply. Relative strength answers a simple question: is this asset performing better or worse than the opportunity set?
This is different from the Relative Strength Index (RSI). RSI measures an asset's own momentum. Relative strength compares the performance of one asset with another.
1. Choose a benchmark that makes sense
The comparison should match the decision. A UK large-cap share might first be compared with the FTSE 100, then with its sector. A US semiconductor share could be compared with the S&P 500 and a semiconductor index. Gold may be compared with a broad commodity index or, for a portfolio question, with equities or bonds.
A convenient benchmark is not always a useful one. Currency, geography, sector and trading hours can distort the result. Record both instruments and keep the benchmark consistent while evaluating the same thesis.
2. Build and read the ratio
Relative strength is commonly plotted as:
Asset price ÷ benchmark price
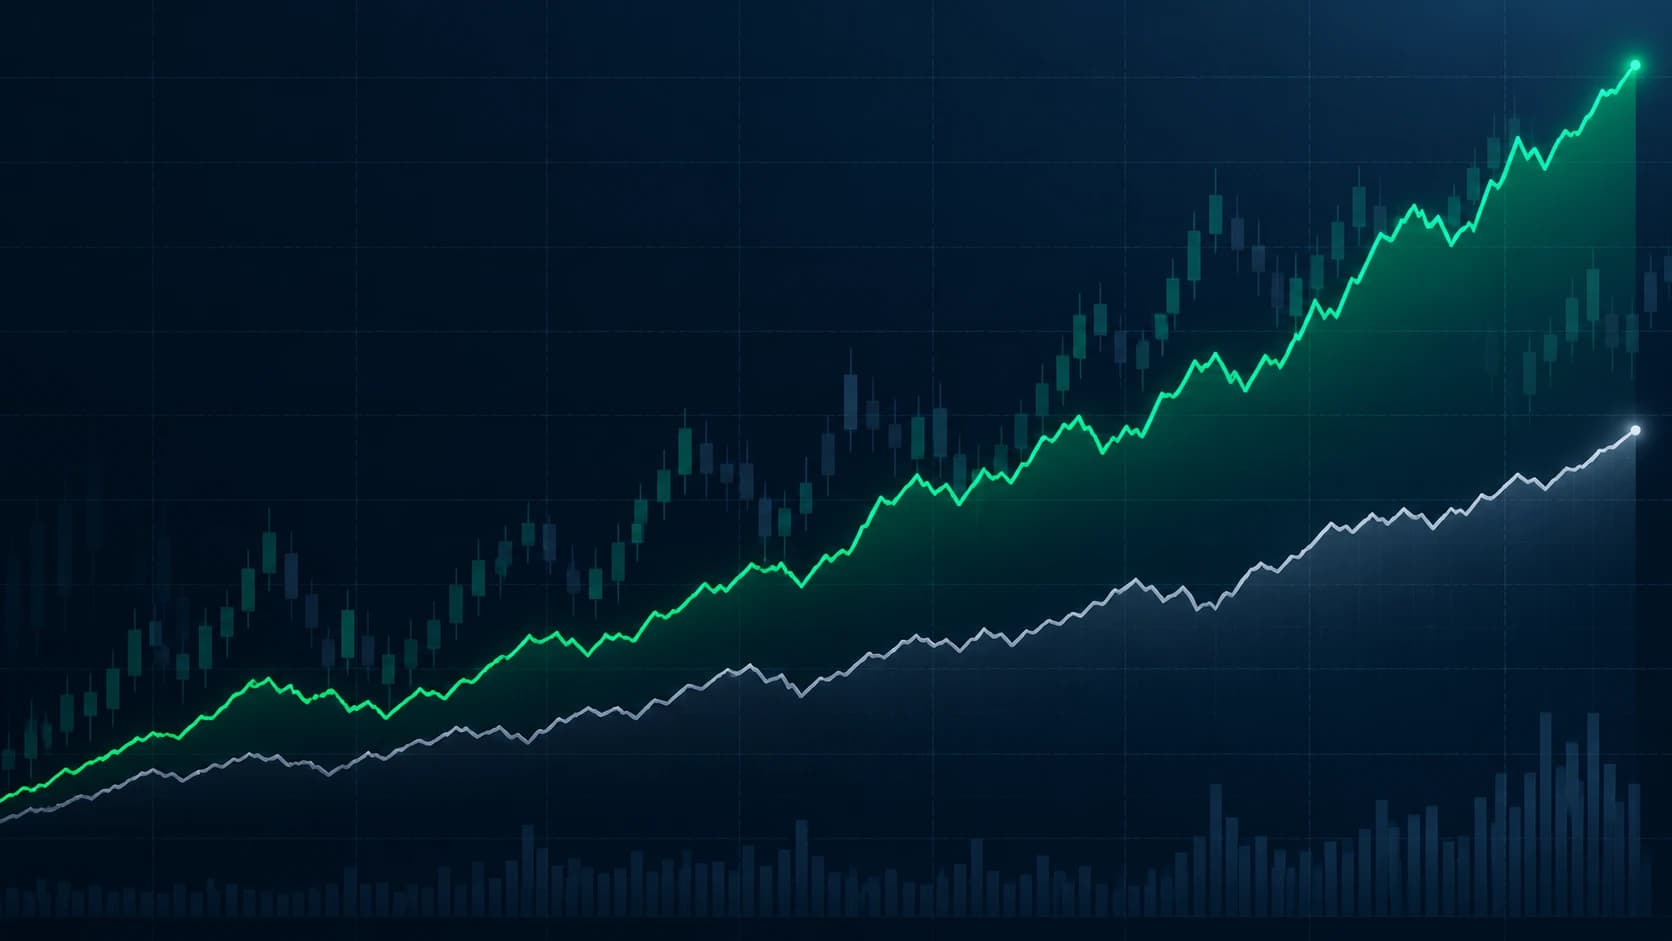
If the line rises, the asset is outperforming the benchmark. If it falls, the asset is underperforming. The absolute ratio level matters less than its direction, structure and rate of change.
On a daily chart, mark ratio swing highs and lows just as you would on a price chart. Higher highs and higher lows show improving leadership. A break below a well-established ratio trend can warn that leadership is weakening, even if the asset's nominal price has not yet broken down.
3. Combine relative and absolute trends
The strongest condition for a long watchlist is often an asset rising in absolute terms while its relative-strength line also rises. An asset falling while the ratio falls is weak on both measures.
Mixed readings require more care:
- Price up, ratio down: the market is lifting the asset, but it is lagging its benchmark.
- Price down, ratio up: the asset is falling, yet holding up better than the benchmark.
- Price sideways, ratio up: potential accumulation or emerging leadership, but price confirmation is still needed.
Relative strength ranks candidates; it does not replace a price trigger, invalidation level or risk limit.
4. Compare like with like
Total-return indices include dividends, while ordinary price charts may not. Leveraged ETFs, different currencies and instruments with different closing times can produce misleading ratios. Corporate actions and thin trading can also create false jumps.
Use adjusted data where appropriate, align the observation period and avoid treating small one-day changes as a durable trend. Weekly confirmation can help when a daily ratio is noisy.
Worked example
Assume Share A rises from £40 to £44 over ten sessions, a gain of 10%. During the same period, its sector index rises from 2,000 to 2,300, a gain of 15%.
- Starting ratio: 40 ÷ 2,000 = 0.0200
- Ending ratio: 44 ÷ 2,300 = 0.0191
The share made money in pounds, but its ratio fell by about 4.3%. It underperformed the sector. A trader seeking sector leadership might keep it off the preferred long list until the ratio forms a higher low and breaks its recent downtrend.
Now suppose Share B falls 3% while the same sector falls 8%. Share B's rising ratio identifies resilience, but it is still in an absolute downtrend. A conditional plan could wait for Share B to reclaim a daily resistance level while the ratio remains above its latest swing low. Failure below the price swing low would invalidate that setup.
Common mistakes
- Confusing relative strength with RSI.
- Selecting a benchmark after seeing which comparison looks best.
- Comparing instruments in different currencies without considering exchange-rate effects.
- Calling an asset bullish only because it falls less than the market.
- Ignoring dividends, corporate actions or mismatched closing times.
- Entering solely on a ratio signal without defining price risk.
Practical checklist
- What decision is the comparison meant to support?
- Is the benchmark relevant to the asset's sector, region and currency?
- Are both series adjusted and aligned consistently?
- Is the ratio making higher highs and higher lows, or the opposite?
- Does the absolute price trend agree with the relative trend?
- What price event would trigger an entry?
- Where is the trade thesis invalidated?
- Has position size been set from the planned loss, not conviction?
The Money Man view
Relative strength is most useful as a selection tool. It can separate leaders from passengers during a broad rally and highlight resilience during a sell-off. On the daily timeframe, we give more weight to a sustained ratio structure than to a single session. The view changes when the ratio breaks its established structure or the price action fails to confirm.
Educational information only. This tutorial is AI-assisted and published by The Money Man. It is not personalised investment advice, a recommendation or a promise of returns. Trading and investing can result in losses. Verify data and consider your circumstances before acting.