Support and Resistance Zones: A Practical Trading Guide
Last saved:
Executive Summary
- ✦Treat support and resistance as zones rather than guaranteed price barriers.
- ✦Mark a small number of meaningful levels on the decision timeframe.
- ✦Wait for completed evidence before choosing the hold or failure scenario.
- ✦Calculate position size from a defined invalidation point.
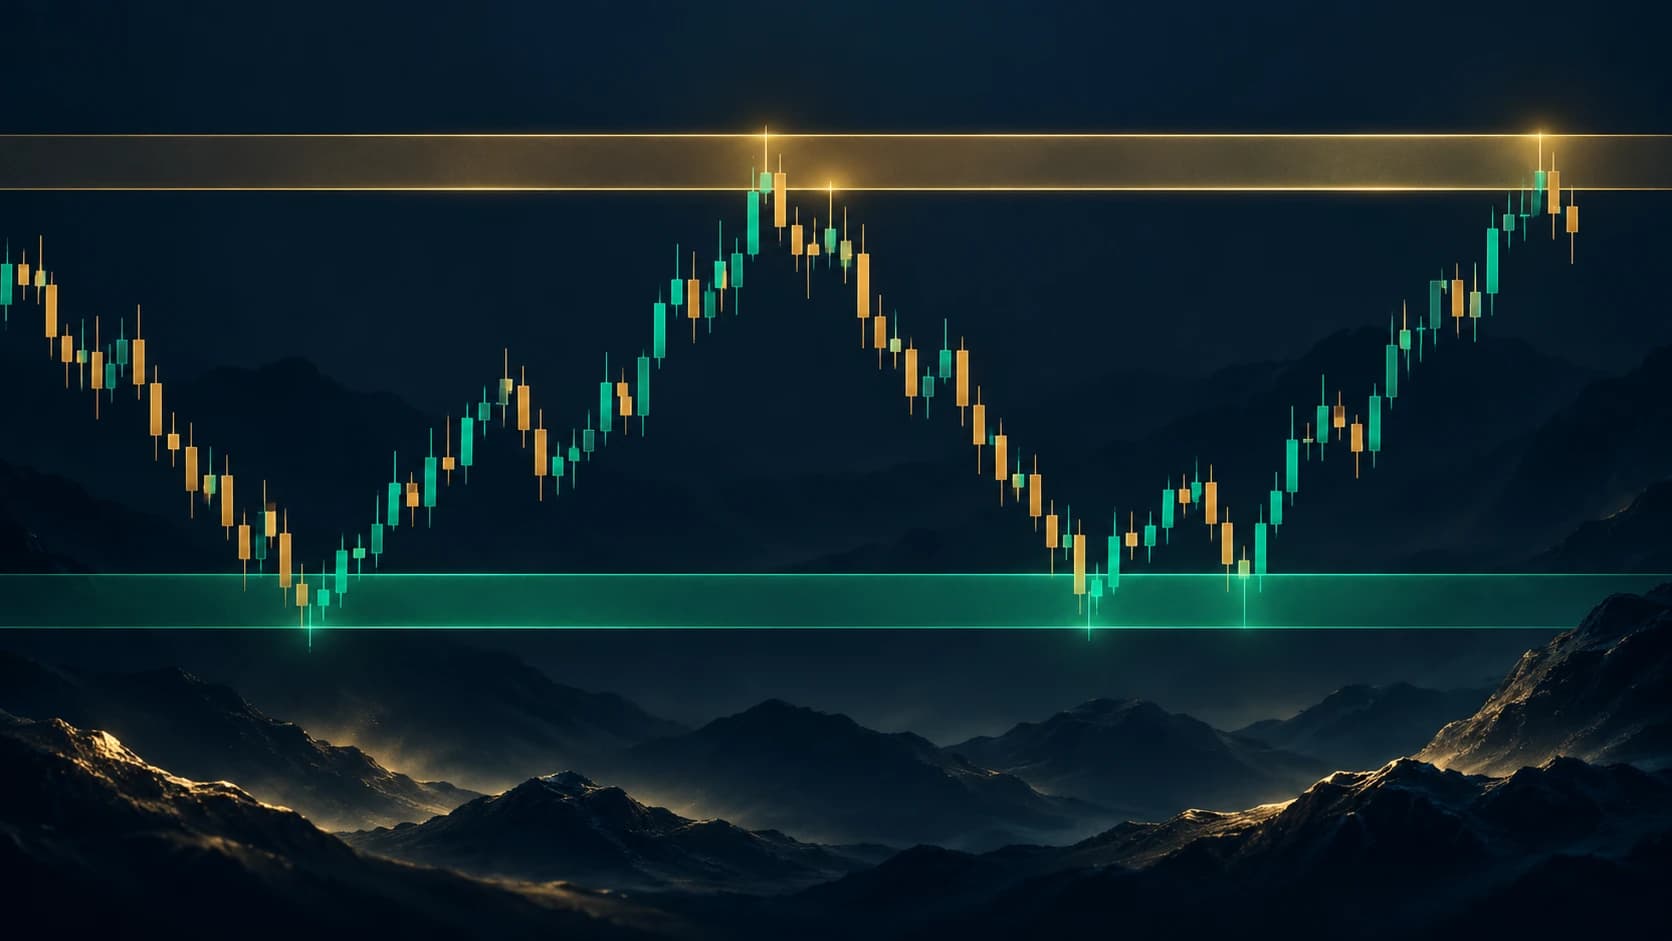
Support and resistance describe areas where buying or selling has previously changed the direction or speed of price. They are useful reference zones, not barriers that must hold.
Learning objective
This lesson shows how to mark zones on a daily chart, judge a reaction, build conditional scenarios and avoid treating every touch as a trade signal.
Why zones are better than perfect lines
Markets contain different participants, order sizes and time horizons. A reversal may begin at one price on one occasion and several points away on another. Marking a narrow band around repeated reactions often represents this behaviour better than drawing a line through one wick.
Start with the higher timeframe used for the decision. On a daily chart, look for visible swing highs and lows, repeated closing-price reactions, gaps, breakout origins and areas where price moved away with unusual force. Give more weight to zones that produced several clear reactions without stretching the band so widely that it loses meaning.
A repeatable marking process
- Zoom out and identify the current trend or range.
- Mark the most obvious recent swing high and swing low.
- Add zones where several candle bodies or wicks cluster.
- Remove minor levels that do not change the trading decision.
- Note whether price is approaching from above or below.
- Wait for evidence at the zone instead of predicting the reaction.
Old resistance can sometimes act as support after a confirmed breakout, and old support can become resistance after a breakdown. This role reversal is a hypothesis until price actually reacts.
Worked example
Assume a hypothetical share has repeatedly turned lower between £52.00 and £52.50, creating a resistance zone. It later closes at £53.10 on strong participation. A trader does not automatically buy the first move above £52.50.
One bullish scenario is a daily close above the zone followed by a pullback that holds between £52.00 and £52.50. A bearish or failed-breakout scenario is a return below £52.00 with a daily close back inside the former range. The invalidation point and position size must be defined before entry.
The same zone supports two different plans because the evidence after price arrives determines which scenario is active.
What makes a reaction more useful?
- A completed candle close rather than an unfinished intraday move.
- Rejection followed by a higher low at support or lower high at resistance.
- Increased volume where reliable volume data exist.
- Alignment with the broader trend and a known catalyst.
- Enough distance to the next opposing zone to justify the planned risk.
No single confirmation removes uncertainty. Confluence should improve the clarity of the decision, not become an excuse to ignore risk.
Common mistakes
- Drawing so many levels that every price is labelled important.
- Treating one isolated wick as permanent support or resistance.
- Entering before the candle or chosen confirmation is complete.
- Assuming a level becomes stronger after unlimited tests; repeated orders can also be consumed.
- Ignoring spread, slippage and gaps around news.
- Moving a zone after entry merely to keep a losing idea alive.
Pre-trade checklist
- Is the zone visible on the decision timeframe?
- Has it produced more than one meaningful reaction?
- Is price approaching from above or below?
- What confirms a hold, breakout or failed breakout?
- Which price action invalidates the setup?
- Is position size calculated from that invalidation point?
- Where is the next opposing zone?
- Is a scheduled event likely to distort the reaction?
The Money Man lesson
Use support and resistance to organise decisions, not to predict certainty. Mark a small number of meaningful zones, define both the hold and failure scenarios, wait for completed evidence and size the trade from the invalidation point.
Educational information only. The example is hypothetical. Support and resistance can fail without warning, and orders may execute at a worse price during gaps or fast markets.