Trading Win Rate: Why Sample Size Changes the Story
Last saved:
Executive Summary
- ✦The same win rate carries different evidence at 10 trades and 100 trades.
- ✦Add an uncertainty interval and report the sample period.
- ✦Profitability depends on average wins and losses, not win rate alone.
- ✦Separate materially different setups and market regimes.
Learning objective: understand why a reported win rate is uncertain, how sample size changes that uncertainty and why profitability also depends on the size of wins and losses.
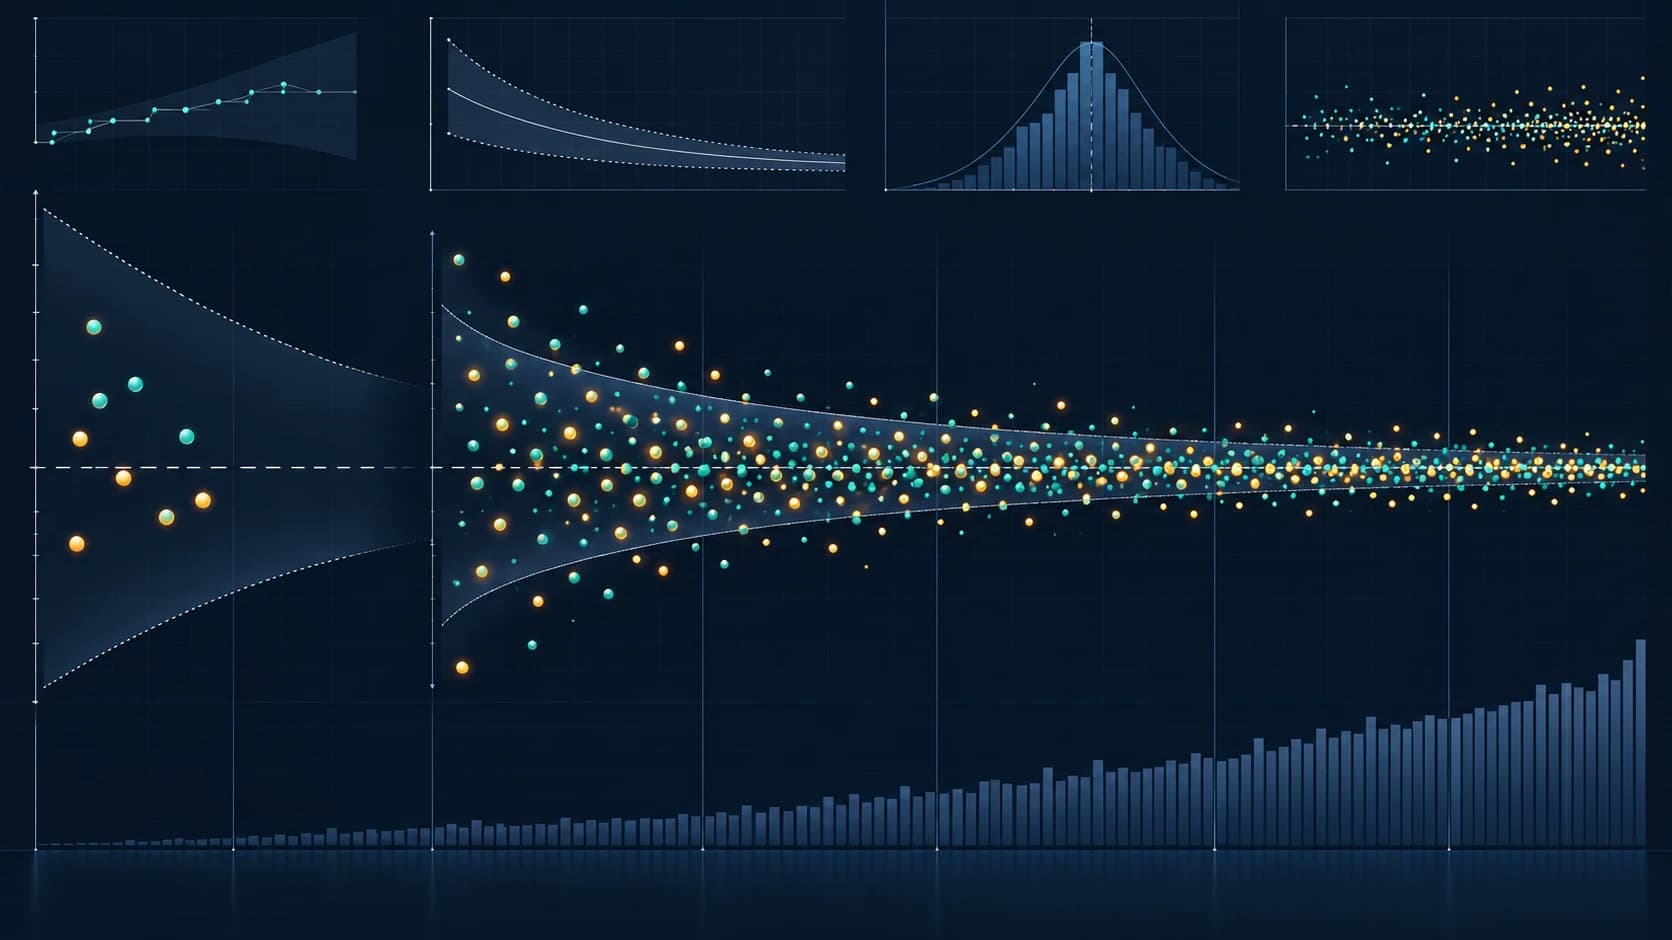
A trader wins 7 of 10 trades and reports a 70% win rate. Another wins 70 of 100. The displayed percentage is identical, but the evidence is not. Ten observations leave much more uncertainty about the underlying process.
Win rate is an estimate, not a permanent property. Market regime, execution and rule changes can shift it over time.
1. Record comparable trades
Before calculating, define what counts as a trade. Treat partial exits consistently, combine multiple fills that belong to one idea and use net results after costs. Separate materially different setups, markets and timeframes.
Mixing a daily trend strategy with intraday mean reversion can create an average that describes neither method.
2. Add an uncertainty range
A confidence interval gives a range of plausible win probabilities under a statistical model. For binary win/loss data, a Wilson interval is often more reliable than the simple normal approximation, especially with small samples or extreme win rates.
The interval narrows as the sample grows. It never removes uncertainty, and it assumes the observations are reasonably comparable. Clustered trades during one favourable regime may provide less independent information than the count suggests.
3. Do not confuse win rate with expectancy
A high win rate can lose money when occasional losses are large. A low win rate can be profitable when winners are much larger than losses.
Expectancy = (win rate × average win) − (loss rate × average loss)
Use results after fees, spread and slippage. Also inspect the distribution: one outlier winner can make average expectancy look stronger than the typical trade.
4. Watch for changing conditions
Rolling win rates can reveal drift, but very short windows are noisy. Compare results by setup and regime, and look for changes in average win, average loss and execution quality alongside win rate.
Do not keep trading a deteriorating method merely to reach an arbitrary sample target. Risk limits and predeclared review rules still apply.
Worked example
Strategy A records 7 wins from 10 trades: 70%. A 95% Wilson interval is roughly 40% to 89%. Strategy B records 70 wins from 100: also 70%, with an interval roughly 60% to 78%.
The second estimate is more precise, though it is not guaranteed to persist. Now assume Strategy B's average winner is +0.6R and average loser is -1.5R:
Expectancy = (0.70 × 0.6R) − (0.30 × 1.5R) = -0.03R per trade
Despite a 70% win rate, the hypothetical strategy loses slightly before considering whether its historical sample is representative. The example shows why win rate alone is not an edge.
Common mistakes
- Treating ten trades as strong statistical evidence.
- Combining unrelated setups into one win rate.
- Ignoring costs and classifying tiny gross gains as wins.
- Optimising rules to raise win rate while worsening losses.
- Assuming trades are fully independent.
- Publishing a point estimate without sample size or time period.
Practical checklist
- Is the definition of a trade consistent?
- Are outcomes net of all practical costs?
- How many comparable observations exist?
- What uncertainty interval surrounds the win rate?
- Are trades clustered by market regime?
- What are average win, average loss and expectancy in R?
- Does one outlier dominate the result?
- Has the strategy or execution process changed during the sample?
The Money Man view
Win rate is useful only with context. We report the sample size, uncertainty and payoff distribution, then ask whether the result survives different regimes. A lower but stable win rate with controlled losses can be more valuable than a headline number built on a short favourable run.
Educational information only. This tutorial is AI-assisted and published by The Money Man. It is not personalised investment advice, a recommendation or a promise of returns. Statistical estimates can fail and trading can result in losses.