Volume Profile Explained: POC, Value Area and Data Limits
Last saved:
Executive Summary
- ✦Volume profile distributes reported activity by price; POC is the highest-volume row and value area contains a chosen share of volume.
- ✦Session, range, row size, data source and venue coverage can materially change every profile level.
- ✦Volume proves that transactions occurred but does not by itself identify buyer intent, seller intent or opening versus closing trades.
- ✦Treat completed profile references as descriptive zones and require measurable confirmation and invalidation rules.
Volume Profile Explained: POC, Value Area and Data Limits
Learning objective
By the end of this tutorial, you should be able to explain how a volume profile distributes activity by price, calculate a simple point of control and value area, and use those references without treating historical volume as a prediction or proof of buyer and seller intent.
What volume profile changes
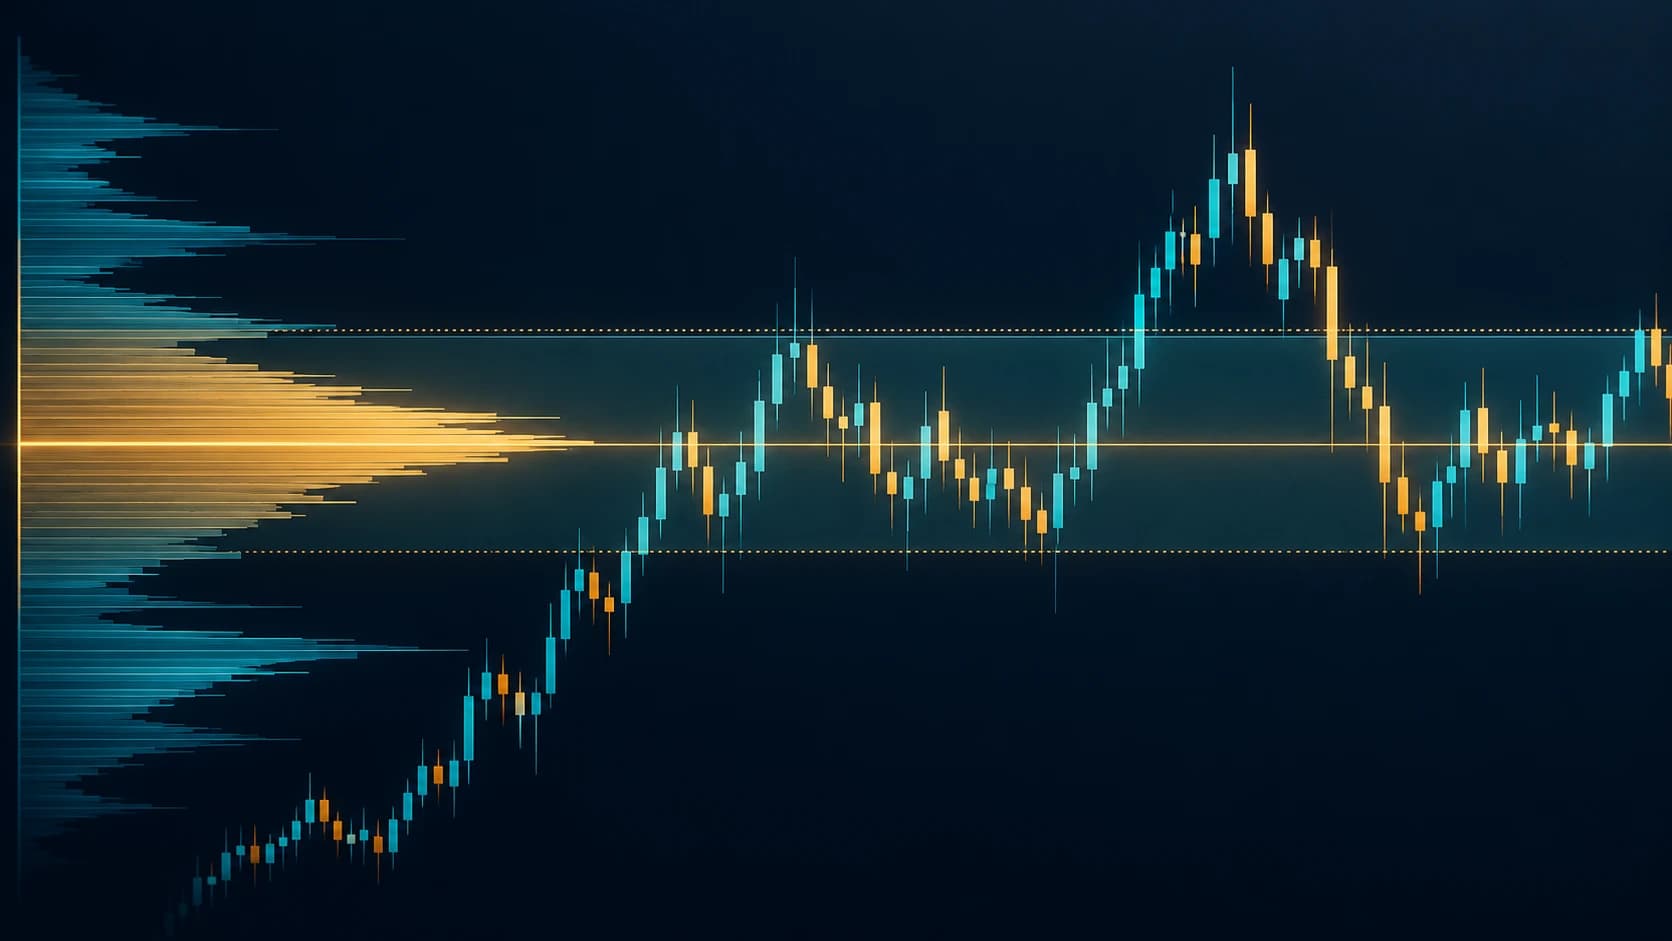
A normal volume bar shows how much traded during a period of time. A volume profile reorganises activity by price level. Horizontal bars show where more or less reported volume occurred inside a chosen session or range.
The tool is descriptive. It can show where the market previously spent volume, but it cannot guarantee that the same price will hold as support or resistance when conditions change.
1. Core terms
Point of control, or POC
The price row with the highest volume in the selected profile.
Value area, or VA
The group of price rows containing a chosen percentage of profile volume. Many platforms default to 70%, but this is a user setting rather than a law of markets.
Value area high and low
- VAH: the highest included price row in the value area
- VAL: the lowest included price row in the value area
High-volume node, or HVN
A local bulge in the profile. It shows that more activity was recorded around that price than nearby rows.
Low-volume node, or LVN
A local thin area. It shows that relatively little activity was recorded in that part of the selected range.
These labels describe the chosen data and binning. A different session, row size or venue can produce different levels.
2. Worked example
Assume a simplified session profile reports:
| Price row | Volume |
|---|---|
| 103 | 2,000 |
| 102 | 1,000 |
| 101 | 4,000 |
| 100 | 2,000 |
| 99 | 1,000 |
Total volume is 10,000 units.
The highest-volume row is 101 with 4,000 units, so POC = 101.
For a 70% value area, the target is:
10,000 × 70% = 7,000 units
Start with the POC: 4,000. Add the larger adjacent row, price 100 with 2,000, bringing the total to 6,000. Add price 102 with 1,000 to reach 7,000.
In this simplified method:
- VAL = 100
- POC = 101
- VAH = 102
Platforms can use different tie-breaking, lower-timeframe allocation and rounding rules. Always learn how your chart calculates the profile before comparing levels.
3. What volume does and does not reveal
Every completed trade has a buyer and seller. Volume tells you that a transaction occurred; it does not by itself say whether new bullish buyers, short sellers, position exits or hedges caused the trade.
CME notes that a volume spike cannot by itself distinguish buying from selling or opening from closing activity. Some charting platforms divide volume into “up” and “down” categories using bar direction or another classification rule. That is not necessarily the same as trade-by-trade buyer-initiated and seller-initiated volume.
Treat the profile as a map of activity, not a direct map of conviction.
4. Session and range selection matter
A profile has no meaning without a defined sample:
- One regular trading session
- Pre-market, main session and post-market together or separately
- One week or month
- A fixed range covering a trend or consolidation
- The currently visible chart range
Changing the sample changes total volume, POC and value area. Extended-hours activity can matter for some equities but may be thin and less representative. Futures trade across long sessions; cash equities have an official main session; crypto trades continuously across fragmented venues.
Write down the session, time zone and start and end dates before using a level in a trading plan.
5. Row size changes the answer
The tool groups prices into rows or bins. Very fine rows can make the profile noisy and sensitive to small data differences. Very broad rows can hide meaningful structure.
The worked example used one-point rows. If those prices were grouped into two-point bins, the POC and boundaries could shift. A level such as 101 should therefore be treated as a zone whose width reflects tick size, row size and normal volatility, not as an infinitely precise price.
This fits our broader support and resistance guide: market references are normally zones and scenarios, not guarantees.
6. Developing versus completed profiles
A completed prior session's profile is fixed unless the data are revised. A developing current-session profile changes with every new trade:
- POC can migrate.
- VAH and VAL can expand or shift.
- A low-volume area can fill in later.
Do not plan from an early-session developing POC as though it were the final level. Record the timestamp and distinguish developing levels from completed-session references.
7. Data limitations by instrument
Exchange-traded shares and futures
Volume normally counts executed shares or contracts on the covered venue or consolidated feed. Confirm whether off-exchange activity and all relevant venues are included.
Indices and CFDs
An index itself may not trade. Some platforms use tick volume, meaning the number of price updates, for indices, forex or CFDs. Tick volume is not the same as executed contract volume.
Crypto
Crypto volume is fragmented across exchanges. A profile from one venue may not represent global activity. Base-volume and quote-volume settings can also produce different shapes.
Lower-timeframe approximation
Charting platforms may reconstruct a higher-timeframe profile from smaller bars and allocate volume across price rows with approximations. Data history and plan limits can change the calculation depth.
8. A conditional trading framework
Volume-profile references become more useful when combined with price behaviour and risk controls:
- Define the completed session or fixed range.
- Mark POC, VAH, VAL and major nodes as zones.
- Note the higher-timeframe trend and volatility regime.
- Build at least two scenarios: acceptance inside value and rejection outside value.
- Require observable confirmation such as a close, retest or sustained trade—not a single touch.
- Place invalidation beyond a logical zone, allowing for normal noise.
- Size the position from stop distance and account risk.
- Avoid treating the profile as a standalone reason to trade.
“Acceptance” and “rejection” are interpretations that must be defined in measurable terms. For example, a trader might define acceptance as two completed bars closing inside the prior value area. The rule should be tested rather than chosen after seeing the outcome.
9. Review process
For each planned use, record:
- Instrument and venue
- Session and time zone
- Data type: actual trade volume or tick volume
- Row size and value-area percentage
- POC, VAH and VAL at decision time
- Whether the profile was completed or developing
- Entry confirmation and invalidation rule
- Slippage, spread and result
This allows a trader to test whether the references added value beyond ordinary price levels and trend context.
Common mistakes
- Treating POC as guaranteed support or resistance.
- Calling volume “buying” or “selling” without an order-flow classification method.
- Changing the visible range until the profile supports a preferred view.
- Comparing profiles built with different sessions or row sizes.
- Using tick volume as if it were consolidated executed volume.
- Ignoring crypto venue fragmentation.
- Treating a developing POC as fixed.
- Placing stops exactly on profile boundaries without allowing for spread and volatility.
Checklist
- Session, range and time zone fixed?
- Actual volume or tick volume identified?
- Venue coverage understood?
- Row size and value-area percentage recorded?
- Completed and developing levels distinguished?
- Levels treated as zones?
- Confirmation and invalidation rules defined?
- Results reviewed against a price-only baseline?
Sources
- TradingView: Volume profile indicators—basic concepts and calculation
- TradingView: Session volume profile charts
- TradingView: Session Volume Profile methodology
- CME Group: What volume can and cannot show
This tutorial was prepared with AI-assisted research and writing under The Money Man editorial workflow. It is educational information, not personalised investment advice or a trading signal. The profile data and levels are hypothetical.