Ulcer Index: Measure Both the Depth and Persistence of Drawdowns
Last saved:
Executive Summary
- ✦The Ulcer Index is the root mean square of percentage drawdowns from running peaks.
- ✦Deep and persistent drawdowns receive more weight than shallow, brief declines.
- ✦Use the same frequency, lookback, currency and cash-flow treatment when comparing strategies.
- ✦Read it beside maximum drawdown, recovery time, return, liquidity and tail-risk measures.
Ulcer Index: Measure Both the Depth and Persistence of Drawdowns
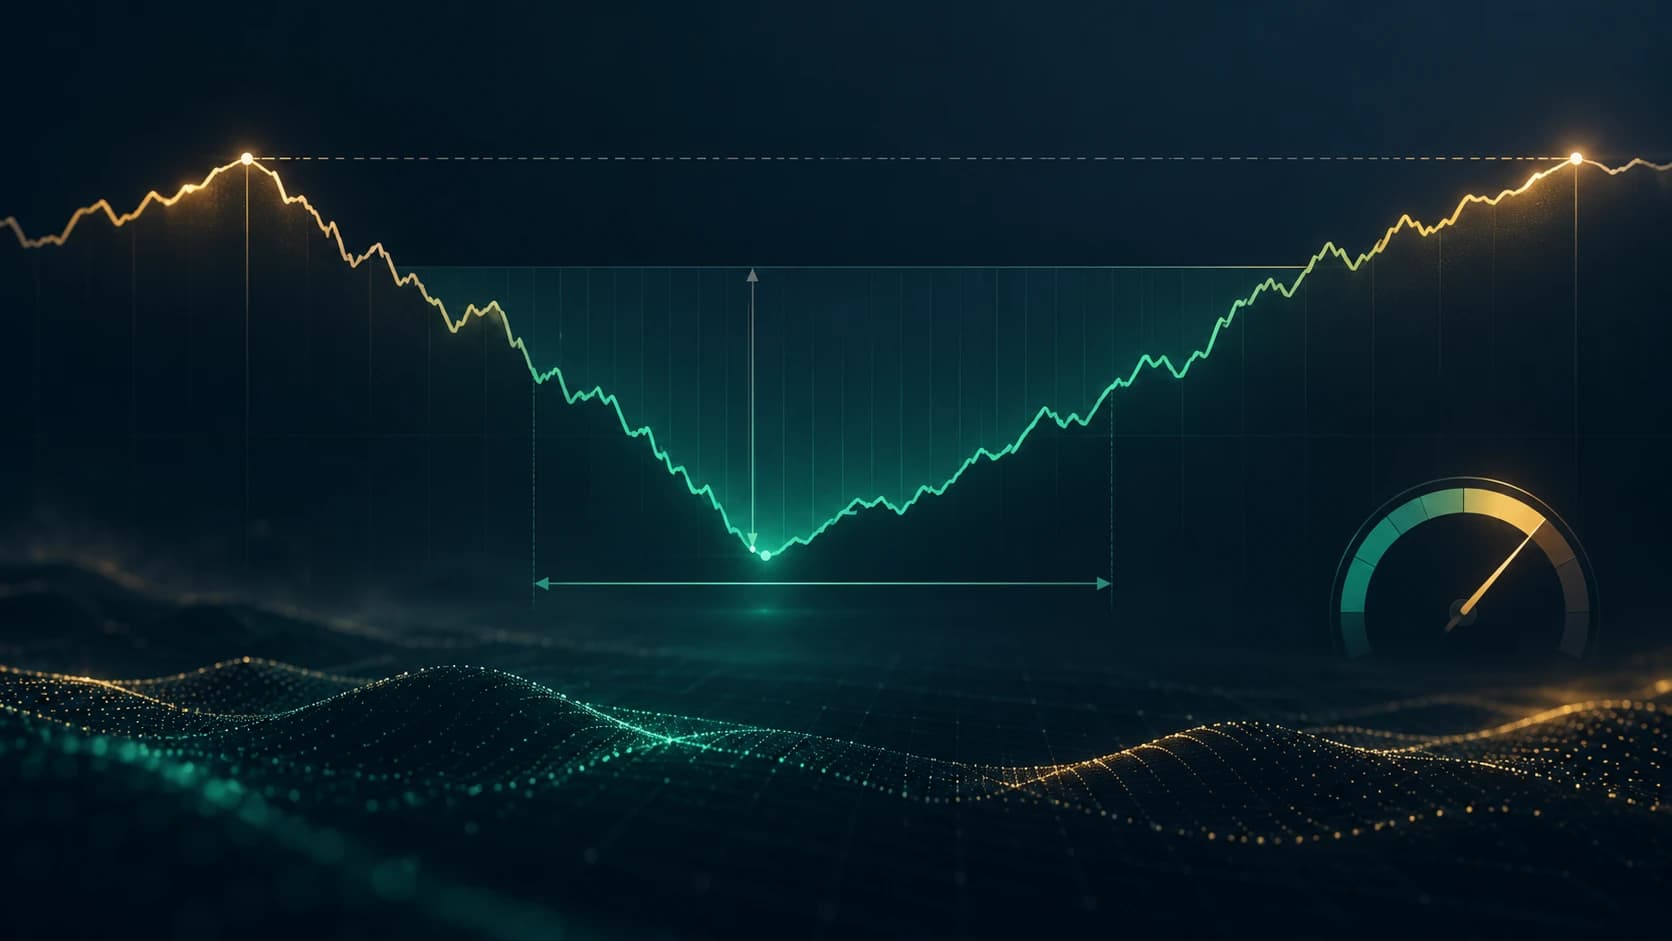
Maximum drawdown records the single deepest fall from a previous peak. The Ulcer Index goes further: it squares every percentage drawdown in a chosen lookback window, averages them and takes the square root. A portfolio that stays underwater for weeks can therefore score worse than one that falls briefly and recovers, even when both share the same maximum drawdown.
বাংলায় পড়ুন: Ulcer Index: Drawdown-এর Depth ও Duration একসঙ্গে মাপুন
Learning objective: By the end of this tutorial, you should be able to calculate the Ulcer Index from an equity series, explain why repeated or persistent drawdowns increase it, compare strategies on the same measurement basis and recognise what the metric cannot reveal.
1. Start with the running peak
For each observation, record the highest account value seen up to that point. This is the running peak.
Then calculate the percentage drawdown:
Drawdown % = (current value ÷ running peak − 1) × 100.
At a new high, drawdown is 0%. Below the peak, it is negative. The sign does not affect the final calculation because each drawdown is squared, but keeping the negative sign makes the equity path easier to interpret.
2. Calculate the Ulcer Index
For a window containing N observations:
Ulcer Index = square root of [sum of squared drawdown percentages ÷ N].
The result is expressed in percentage points. It is a root-mean-square measure of drawdown, not a probability and not a forecast of the next loss.
Squaring has two effects:
- deeper drawdowns receive much more weight than shallow ones;
- every observation spent below the peak contributes to the score.
That second feature introduces duration indirectly. A long recovery creates more underwater observations than a quick recovery.
3. Worked example
Assume a hypothetical strategy has five daily closing equity values:
| Day | Equity | Running peak | Drawdown | Squared drawdown |
|---|---|---|---|---|
| 1 | £100 | £100 | 0.00% | 0.00 |
| 2 | £96 | £100 | −4.00% | 16.00 |
| 3 | £92 | £100 | −8.00% | 64.00 |
| 4 | £98 | £100 | −2.00% | 4.00 |
| 5 | £105 | £105 | 0.00% | 0.00 |
The mean squared drawdown is:
(0 + 16 + 64 + 4 + 0) ÷ 5 = 16.80.
The Ulcer Index is:
Square root of 16.80 = 4.10%.
The strategy's maximum drawdown in this small sample is 8%, while its Ulcer Index is 4.10%. These figures answer different questions: maximum drawdown reports the worst point; the Ulcer Index summarises the full underwater path.
4. Why recovery speed changes the score
Consider two hypothetical strategies that both fall 8% from a peak.
- Strategy A recovers to a new high after two observations.
- Strategy B remains between 6% and 8% below its peak for ten observations.
Both can report the same maximum drawdown, but Strategy B accumulates many more squared underwater readings. Its Ulcer Index will normally be higher when the same observation frequency and lookback are used.
This makes the metric useful for analysing the lived experience of a drawdown. Capital tied up below a peak can limit new opportunities, test a trader's discipline and create redemption or margin pressure even when the final maximum loss is unchanged.
5. Use the same frequency and lookback
An Ulcer Index calculated from daily closes is not directly comparable with one calculated from weekly closes. Daily data captures more of the path and usually includes more underwater observations.
The lookback also matters. A 20-session window can forget an older decline that remains visible in a 252-session window. Before comparing two strategies, align:
- observation frequency;
- lookback length;
- valuation time and time zone;
- treatment of fees, financing and cash flows;
- return currency;
- whether the series uses closed equity or includes open-position mark-to-market values.
Without those controls, a lower score may reflect different data preparation rather than better drawdown behaviour.
6. Compare it with maximum drawdown and volatility
No single risk measure is sufficient.
Maximum drawdown
Maximum drawdown captures the worst peak-to-trough loss in the sample. It is easy to understand but ignores how long the loss lasted and what happened during the rest of the period.
Standard deviation
Standard deviation treats variation around an average as risk. Strong upside moves can increase it even though investors generally welcome them. The Ulcer Index only penalises observations below a prior peak.
Ulcer Index
The Ulcer Index reflects drawdown depth and persistence but does not show the single worst loss, the recovery date, tail shape, liquidity risk or gap exposure. Read it beside maximum drawdown and the Calmar Ratio and broader return-risk measures such as the Sharpe and Sortino ratios.
7. Do not rank unlike strategies blindly
A lower Ulcer Index is not automatically a better strategy. A cash-heavy portfolio may have a low score and a low return. An option-selling strategy may appear smooth until a rare gap. An illiquid asset valued infrequently can understate the true path.
Compare the metric with:
- annualised and cumulative return;
- maximum drawdown and time to recovery;
- trading costs and turnover;
- leverage and margin exposure;
- liquidity and gap risk;
- concentration and correlation;
- the number of independent market regimes in the sample.
Risk-adjusted metrics are descriptions of a tested history, not guarantees that the relationship will persist.
8. Ulcer Performance Index
Some analysts divide excess return by the Ulcer Index:
Ulcer Performance Index = (portfolio return − chosen risk-free return) ÷ Ulcer Index.
This can help compare return earned per unit of historical drawdown pressure, but every input needs a consistent period and frequency. A near-zero Ulcer Index can make the ratio unstable, and changing the risk-free rate or return annualisation can materially change the result.
Treat the ratio as one diagnostic, not as a position-sizing instruction.
9. Spreadsheet workflow
A practical worksheet needs five columns:
- date;
- closing or marked equity;
- running peak;
- percentage drawdown;
- squared percentage drawdown.
For each review date:
- update the equity series after costs;
- extend the running maximum;
- calculate each drawdown from its running peak;
- square the readings inside the selected rolling window;
- average them and take the square root;
- record maximum drawdown and recovery length beside the result.
Plotting both the equity curve and underwater curve often reveals more than the final number alone.
10. Common mistakes
Using returns instead of drawdowns
The input is the percentage distance below the running peak, not the daily return.
Mixing decimals and percentages
A drawdown of −0.08 is −8%. If one series uses decimals and another uses percentages, their indices differ by a factor of 100.
Dropping zero observations
Days at a peak belong in the window. Removing them overstates the average drawdown pressure.
Comparing different sampling frequencies
Daily, weekly and monthly paths contain different information. Align frequency before ranking strategies.
Ignoring cash flows
Deposits and withdrawals can create false peaks or recoveries. Use a properly adjusted performance series.
Treating a low score as proof of safety
Stale pricing, short samples, hidden leverage and rare jump risk can all produce a deceptively smooth history.
Optimising one lookback
A strategy tuned to minimise one historical window may fail in another regime. Review several defensible windows and out-of-sample periods.
11. Practical checklist
- Use an equity series adjusted for fees and external cash flows.
- Define one consistent close time, frequency and currency.
- Calculate drawdown from the running peak.
- Keep zero-drawdown observations in the window.
- Square, average and take the square root.
- Report the lookback and sampling frequency with the result.
- Compare maximum drawdown and time to recovery alongside it.
- Check leverage, liquidity, gaps and tail losses separately.
- Test the metric across different market regimes and out-of-sample data.
- Use it to diagnose risk, not to promise future performance.
The core lesson
Maximum drawdown tells you how deep the worst hole became. The Ulcer Index also responds to how often and how persistently the strategy stayed below its previous peak.
That makes it a useful addition to a trading journal or strategy review, provided every comparison uses the same data rules and the score sits beside return, tail, liquidity and execution measures.
Educational risk disclosure
This tutorial was prepared with AI-assisted research and writing under The Money Man editorial workflow. The equity values and strategies are hypothetical and used only to explain the calculation. This is educational information, not personalised investment advice or a promise of performance. Historical drawdowns can understate future losses, and leveraged or illiquid positions can lose more than a closing-price series suggests.