Sharpe Ratio vs Sortino Ratio: Measuring Return, Volatility and Downside Risk
Last saved:
Executive Summary
- ✦Sharpe measures excess return per unit of total return variability.
- ✦Sortino replaces total volatility with downside deviation below a defined target.
- ✦Calculation conventions, sample frequency and target choice must match before ratios are compared.
- ✦Neither ratio captures drawdown, liquidity, leverage or rare tail loss on its own.
Sharpe Ratio vs Sortino Ratio: Measuring Return, Volatility and Downside Risk
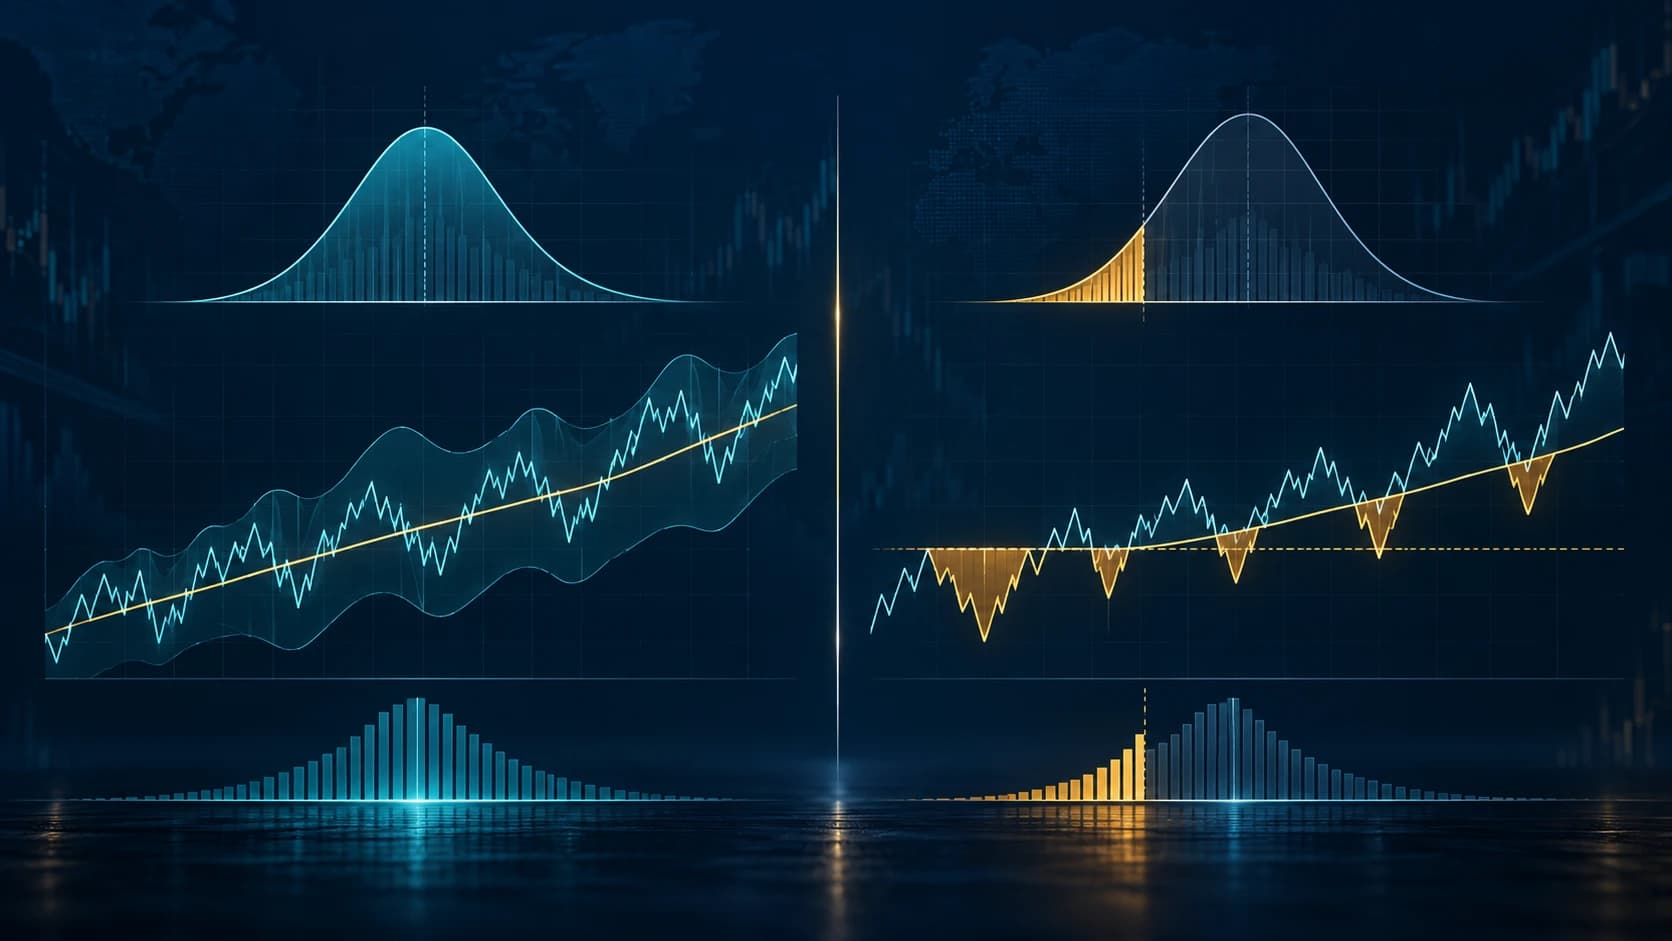
Sharpe and Sortino ratios both compare return with risk, but they answer different questions. Sharpe treats every deviation in returns as variability. Sortino focuses on returns that fall below a chosen target. Neither ratio proves that a strategy is robust, and neither should be read without the calculation method and return history.
বাংলায় পড়ুন: Sharpe Ratio বনাম Sortino Ratio: Return, Volatility ও Downside Risk
Learning objective: calculate simplified Sharpe and Sortino ratios, understand why upside volatility changes one ratio but not the other, and use both without hiding sample, tail and drawdown risk.
1. What the Sharpe ratio asks
William F. Sharpe introduced the reward-to-variability measure in his work on mutual-fund performance. His later explanation, The Sharpe Ratio, discusses the measure and its limits.
A common historical form is:
Sharpe ratio = (average portfolio return − risk-free return) ÷ standard deviation of excess returns
Standard deviation counts variation on both sides of the average. A large positive surprise increases it just as a large negative surprise does. The ratio therefore measures excess return per unit of total variability; it does not claim that upside and downside outcomes feel equally harmful to an investor.
Before comparing two figures, match:
- the same daily, weekly or monthly return frequency;
- the same arithmetic-return convention;
- the same risk-free series and period;
- the same sample window and annualisation method;
- returns after comparable fees and trading costs.
A higher historical Sharpe ratio can describe a smoother realised path. It is not a forecast or proof that the next loss will be small.
2. What the Sortino ratio changes
Sortino replaces total standard deviation with downside deviation relative to a minimum acceptable return, or MAR:
Sortino ratio = (average portfolio return − MAR) ÷ downside deviation relative to MAR
The CFA Institute explanation of the Sortino ratio notes that the target may be zero, a risk-free rate, an index return or another investor-defined objective. Frank Sortino and Lee Price set out the broader framework in Performance Measurement in a Downside Risk Framework.
One common downside-deviation calculation is:
Downside deviation = √[Σ min(0, return − MAR)² ÷ N]
Only shortfalls below the target contribute to the squared sum, while N is the total number of observations. Some platforms divide by the number of below-target observations instead, or use a different target convention. Those choices change the answer. State the formula; do not compare figures from unidentified calculators.
3. Worked example: the same downside, different upside
Consider two hypothetical six-month strategies. Returns are monthly, the risk-free rate and MAR are both assumed to be 0%, and the illustration uses population standard deviation and total observations in downside deviation.
| Month | Strategy A | Strategy B |
|---|---|---|
| 1 | +3% | +7% |
| 2 | −1% | −1% |
| 3 | +3% | +1% |
| 4 | −1% | −1% |
| 5 | +3% | +1% |
| 6 | −1% | −1% |
Both average +1% per month. Both also have the same three −1% shortfalls, so each has downside deviation:
√[(1² + 1² + 1²) ÷ 6] = 0.707%
Their Sortino ratios are therefore identical:
1% ÷ 0.707% = 1.41
But Strategy B has one much larger positive month. Strategy A's standard deviation is 2.00%, while Strategy B's is approximately 2.83%. Their monthly Sharpe ratios are:
- Strategy A: 1% ÷ 2.00% = 0.50
- Strategy B: 1% ÷ 2.83% = 0.35
Sharpe marks Strategy B down for the extra variation even though it came from an upside observation. Sortino does not. This does not make Sortino automatically superior: the two ratios describe different features, and six observations are far too few for a reliable strategy judgement.
4. Choose the target before seeing the answer
A 0% MAR asks whether returns fell below zero. A 0.3% monthly MAR asks whether they missed that required return. An index target asks whether the strategy failed to keep pace with a benchmark.
Changing the target after seeing the history is a form of result selection. Record the target and reason before calculating the ratio. For cash-like or liability-driven objectives, a relevant hurdle can be more informative than zero. For an active strategy, benchmark-relative analysis may be useful, but it answers a different question from avoiding an absolute loss.
5. Annualisation needs compatible data
Practitioners often annualise a periodic ratio by multiplying it by the square root of the number of periods in a year: √252 for daily data or √12 for monthly data. That shortcut assumes consistently sampled returns and behaves best when returns are independent and similarly distributed.
Serial correlation, stale prices, infrequent valuation, overlapping returns and changing leverage can make a smooth history look safer than it is. Do not mix a monthly average return with a daily volatility estimate. Show both the unannualised calculation and the annualisation rule when the number will influence a decision.
6. Negative and near-zero ratios need care
When the average return is below the risk-free rate or MAR, the numerator is negative. Ranking negative ratios as if a less negative value always identifies a better allocation can be misleading, especially when changing the denominator alters the ordering.
A downside deviation of zero also does not prove zero risk. It may mean the short sample contained no observations below the target. The next observation can change the figure sharply. Report the count of below-target periods alongside Sortino and the total sample beside both ratios.
7. Both ratios can miss the loss that matters
Historical ratios compress a return path into one number. They do not directly show:
- maximum drawdown and recovery time;
- overnight gaps or the worst trade;
- liquidity and slippage under stress;
- leverage, margin calls and forced liquidation;
- clustered losses across correlated positions;
- hidden option-like exposure or rare tail losses;
- whether the backtest was selected from many failed versions.
A strategy that earns small, steady gains before an occasional large loss may look strong until the tail event enters the sample. Add drawdown and recovery maths, profit factor and the distribution of trade outcomes. Use Monte Carlo sequence-risk testing to examine more paths than the single historical order.
8. Sample size and stability matter more than a neat score
Calculate ratios across multiple market regimes and rolling windows. A single full-period score can hide deterioration. Compare the result before and after costs, remove one unusually profitable period, and test a modestly worse slippage assumption.
Also show confidence or bootstrap ranges when possible. A ratio estimated from 24 monthly observations carries much more uncertainty than its two decimal places suggest. The win-rate and sample-size guide explains the same general problem: an estimate is not the true underlying parameter.
Common mistakes
- Comparing a daily Sharpe ratio with a monthly Sortino ratio.
- Using different sample windows, fees or risk-free rates.
- Leaving MAR undefined.
- Assuming every platform uses the same downside-deviation denominator.
- Rewarding a high ratio without checking drawdown, leverage and tail risk.
- Treating a short backtest ratio as a stable forecast.
- Annualising autocorrelated or stale returns without qualification.
- Optimising strategy rules to maximise one historical score.
Practical checklist
- Are returns net of fees, spread, slippage and financing?
- Are return frequency and sample dates identical?
- Which risk-free rate or MAR is used, and why?
- Is downside deviation divided by all observations or only shortfalls?
- Is the ratio periodic or annualised, and by what method?
- How many observations and below-target periods exist?
- Is the result stable across rolling windows and regimes?
- What happens after removing the best observation?
- What are maximum drawdown, recovery time and worst loss?
- Do leverage, liquidity or tail exposures change the conclusion?
The Money Man View
Use Sharpe when total variability is relevant to the mandate and Sortino when missing a defined return target is the clearer risk concept. Put the two beside drawdown, tail loss, exposure and sample diagnostics. A ratio is useful when its inputs and limitations remain visible; a high score without those details is marketing, not analysis.
Educational risk disclosure
This tutorial uses simplified hypothetical returns and was prepared with AI-assisted research and writing under The Money Man editorial workflow. It is educational information, not personalised investment advice or a recommendation to use either ratio as a trading rule. Historical and backtested ratios can change materially, and trading or leveraged investing can result in substantial loss.