Ulcer Index: Drawdown-এর Depth ও Duration একসঙ্গে মাপুন
সর্বশেষ সংরক্ষিত:
Executive Summary
- ✦Ulcer Index হলো running peak থেকে percentage drawdown-এর root mean square।
- ✦Deep ও persistent drawdown shallow, brief decline-এর চেয়ে বেশি weight পায়।
- ✦Strategy compare করার সময় same frequency, lookback, currency ও cash-flow treatment ব্যবহার করুন।
- ✦Maximum drawdown, recovery time, return, liquidity ও tail-risk measure-এর সঙ্গে এটি পড়ুন।
Ulcer Index: Drawdown-এর Depth ও Duration একসঙ্গে মাপুন
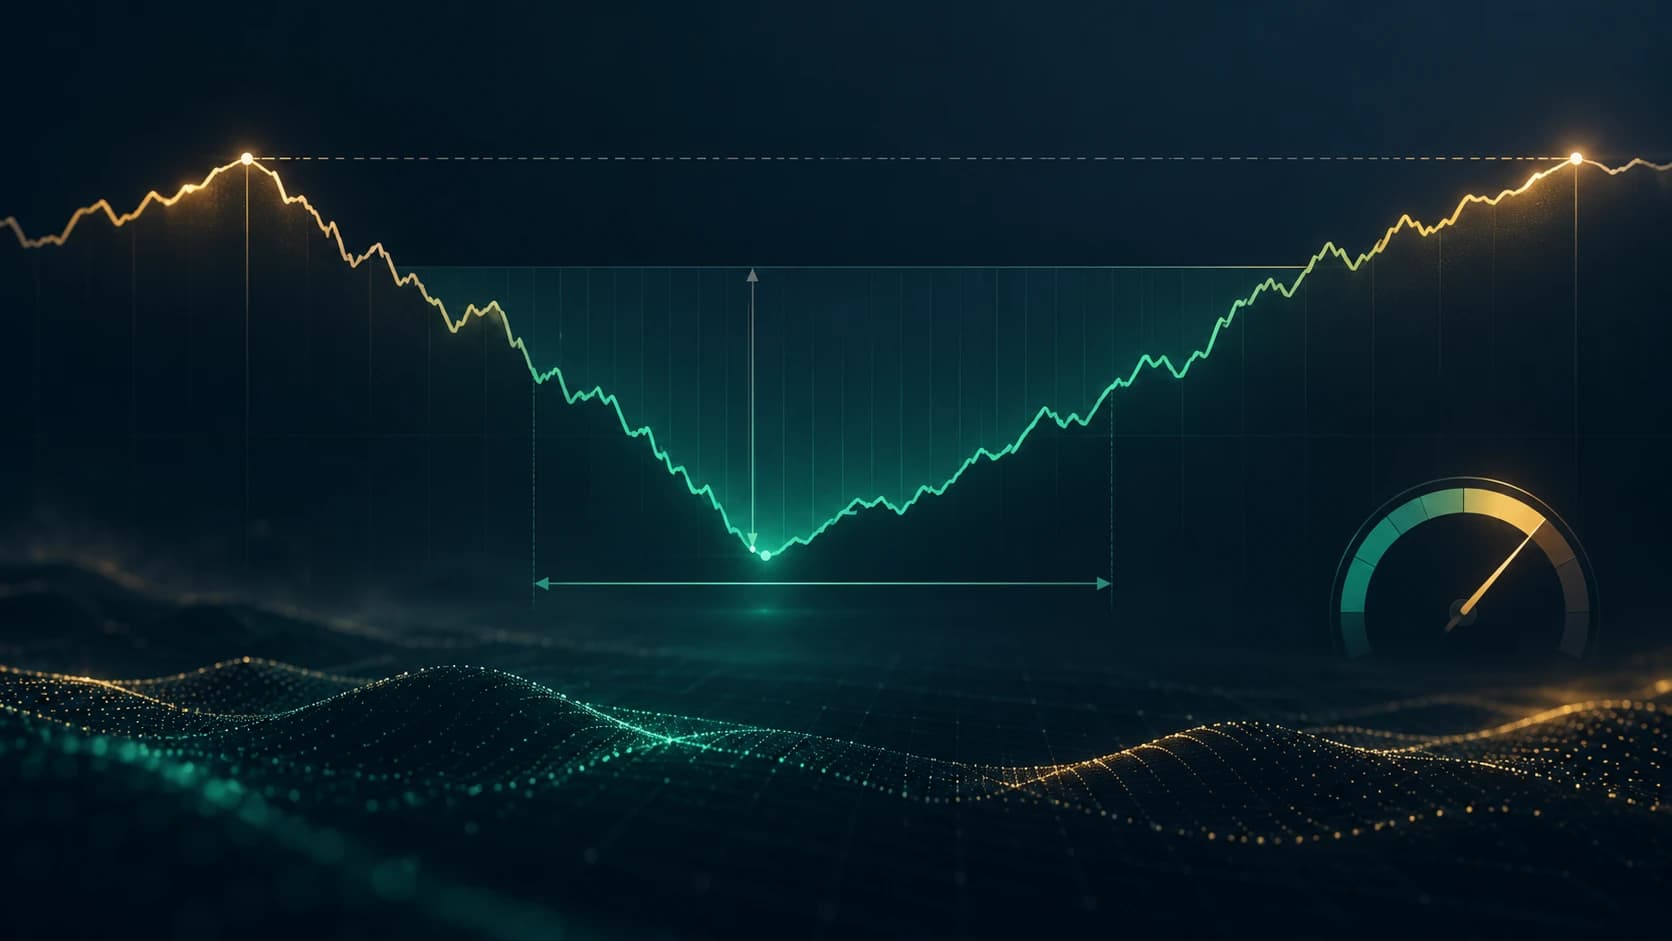
Maximum drawdown previous peak থেকে single deepest fall record করে। Ulcer Index আরও এগিয়ে chosen lookback window-এর every percentage drawdown square করে, average নেয় এবং square root বের করে। তাই same maximum drawdown থাকা সত্ত্বেও weeks ধরে underwater থাকা portfolio, briefly fall করে recover করা portfolio-এর চেয়ে worse score করতে পারে।
Read in English: Ulcer Index: Measure Both the Depth and Persistence of Drawdowns
Learning objective: এই tutorial শেষে আপনি equity series থেকে Ulcer Index calculate করতে, repeated বা persistent drawdown কেন index বাড়ায় explain করতে, same measurement basis-এ strategy compare করতে এবং metric কী reveal করে না তা identify করতে পারবেন।
1. Running peak দিয়ে শুরু করুন
Every observation-এ সেই point পর্যন্ত দেখা highest account value record করুন। এটিই running peak।
তারপর percentage drawdown calculate করুন:
Drawdown % = (current value ÷ running peak − 1) × 100।
New high-এ drawdown 0%। Peak-এর নিচে এটি negative। Every drawdown square করা হয় বলে sign final calculation বদলায় না, তবে negative sign রাখলে equity path interpret করা সহজ হয়।
2. Ulcer Index calculate করুন
N observations-এর window-এর জন্য:
Ulcer Index = [squared drawdown percentage-এর sum ÷ N]-এর square root।
Result percentage point-এ express হয়। এটি drawdown-এর root-mean-square measure; probability নয় এবং next loss-এর forecast নয়।
Squaring-এর two effect:
- deep drawdown shallow drawdown-এর চেয়ে much more weight পায়;
- peak-এর নিচে কাটানো every observation score-এ contribute করে।
Second feature duration-কে indirectly include করে। Slow recovery quick recovery-এর চেয়ে more underwater observation তৈরি করে।
3. Worked example
একটি hypothetical strategy-এর five daily closing equity value:
| Day | Equity | Running peak | Drawdown | Squared drawdown |
|---|---|---|---|---|
| 1 | £100 | £100 | 0.00% | 0.00 |
| 2 | £96 | £100 | −4.00% | 16.00 |
| 3 | £92 | £100 | −8.00% | 64.00 |
| 4 | £98 | £100 | −2.00% | 4.00 |
| 5 | £105 | £105 | 0.00% | 0.00 |
Mean squared drawdown:
(0 + 16 + 64 + 4 + 0) ÷ 5 = 16.80।
Ulcer Index:
16.80-এর square root = 4.10%।
এই small sample-এ strategy-এর maximum drawdown 8%, আর Ulcer Index 4.10%। Figure দুটি different question-এর answer দেয়: maximum drawdown worst point report করে; Ulcer Index full underwater path summarise করে।
4. Recovery speed কেন score বদলায়
Two hypothetical strategy previous peak থেকে 8% fall করেছে।
- Strategy A two observation-এর পরে new high-এ recover করে।
- Strategy B ten observation ধরে peak-এর 6% থেকে 8% নিচে থাকে।
দুটির same maximum drawdown হতে পারে, কিন্তু Strategy B many more squared underwater reading accumulate করে। Same observation frequency ও lookback use করলে এর Ulcer Index normally higher হবে।
এ কারণে drawdown-এর lived experience analyse করতে metric useful। Peak-এর নিচে tied-up capital new opportunity limit করতে, trader discipline test করতে এবং final maximum loss unchanged হলেও redemption বা margin pressure তৈরি করতে পারে।
5. Same frequency ও lookback ব্যবহার করুন
Daily close থেকে calculated Ulcer Index weekly close থেকে calculated index-এর সঙ্গে directly comparable নয়। Daily data path-এর more detail capture করে এবং normally more underwater observation include করে।
Lookback-ও গুরুত্বপূর্ণ। 20-session window একটি older decline ভুলে যেতে পারে যা 252-session window-এ visible থাকে। Two strategy compare করার আগে align করুন:
- observation frequency;
- lookback length;
- valuation time ও time zone;
- fee, financing ও cash-flow treatment;
- return currency;
- series closed equity use করে, নাকি open-position mark-to-market value include করে।
এই control ছাড়া lower score better drawdown behaviour-এর বদলে different data preparation reflect করতে পারে।
6. Maximum drawdown ও volatility-এর সঙ্গে compare করুন
Single risk measure sufficient নয়।
Maximum drawdown
Maximum drawdown sample-এর worst peak-to-trough loss capture করে। এটি easy to understand, কিন্তু loss কতদিন ছিল বা rest of period-এ কী ঘটেছিল তা ignore করে।
Standard deviation
Standard deviation average-এর around variation-কে risk হিসেবে treats করে। Strong upside move-ও এটি বাড়াতে পারে, যদিও investor সাধারণত upside welcome করে। Ulcer Index শুধু prior peak-এর নিচের observation penalise করে।
Ulcer Index
Ulcer Index drawdown depth ও persistence reflect করে, কিন্তু single worst loss, recovery date, tail shape, liquidity risk বা gap exposure দেখায় না। তাই এটি maximum drawdown ও Calmar Ratio এবং Sharpe ও Sortino ratio-এর মতো broader return-risk measure-এর সঙ্গে পড়ুন।
7. Unlike strategy blindly rank করবেন না
Lower Ulcer Index automatically better strategy নয়। Cash-heavy portfolio-এর low score এবং low return দুটোই হতে পারে। Option-selling strategy rare gap-এর আগে smooth দেখাতে পারে। Infrequently valued illiquid asset true path understate করতে পারে।
Metric-এর সঙ্গে compare করুন:
- annualised ও cumulative return;
- maximum drawdown ও recovery time;
- trading cost ও turnover;
- leverage ও margin exposure;
- liquidity ও gap risk;
- concentration ও correlation;
- sample-এ independent market regime-এর number।
Risk-adjusted metric tested history-এর description; relationship future-এ persist করবে এমন guarantee নয়।
8. Ulcer Performance Index
Some analyst excess return-কে Ulcer Index দিয়ে divide করেন:
Ulcer Performance Index = (portfolio return − chosen risk-free return) ÷ Ulcer Index।
এটি unit of historical drawdown pressure প্রতি earned return compare করতে help করতে পারে, কিন্তু every input-এর consistent period ও frequency দরকার। Near-zero Ulcer Index ratio unstable করতে পারে, এবং risk-free rate বা return annualisation বদলালে result materially change করতে পারে।
Ratio-কে one diagnostic হিসেবে treat করুন, position-sizing instruction হিসেবে নয়।
9. Spreadsheet workflow
Practical worksheet-এ five column দরকার:
- date;
- closing বা marked equity;
- running peak;
- percentage drawdown;
- squared percentage drawdown।
Every review date-এ:
- cost-এর পরে equity series update করুন;
- running maximum extend করুন;
- running peak থেকে every drawdown calculate করুন;
- selected rolling window-এর reading square করুন;
- average নিয়ে square root করুন;
- result-এর পাশে maximum drawdown ও recovery length record করুন।
Equity curve এবং underwater curve দুটো plot করলে final number alone-এর চেয়ে বেশি information দেখা যায়।
10. Common mistake
Drawdown-এর বদলে return ব্যবহার করা
Input হলো running peak-এর নিচে percentage distance, daily return নয়।
Decimal ও percentage mix করা
−0.08 drawdown হলো −8%। One series decimal আর another percentage use করলে index 100 times differ করবে।
Zero observation drop করা
Peak-এর day window-এর অংশ। এগুলো remove করলে average drawdown pressure overstate হয়।
Different sampling frequency compare করা
Daily, weekly ও monthly path different information contain করে। Strategy rank করার আগে frequency align করুন।
Cash flow ignore করা
Deposit ও withdrawal false peak বা recovery তৈরি করতে পারে। Properly adjusted performance series use করুন।
Low score-কে safety proof ভাবা
Stale pricing, short sample, hidden leverage ও rare jump risk deceptively smooth history তৈরি করতে পারে।
One lookback optimise করা
One historical window minimise করতে tuned strategy another regime-এ fail করতে পারে। Several defensible window ও out-of-sample period review করুন।
11. Practical checklist
- Fee ও external cash flow-adjusted equity series ব্যবহার করুন।
- One consistent close time, frequency ও currency define করুন।
- Running peak থেকে drawdown calculate করুন।
- Window-এ zero-drawdown observation রাখুন।
- Square করুন, average নিন এবং square root বের করুন।
- Result-এর সঙ্গে lookback ও sampling frequency report করুন।
- পাশে maximum drawdown ও recovery time compare করুন।
- Leverage, liquidity, gap ও tail loss separately check করুন।
- Different market regime ও out-of-sample data-তে metric test করুন।
- Future performance promise নয়, risk diagnose করতে use করুন।
Core lesson
Maximum drawdown worst hole কত deep হয়েছিল তা বলে। Ulcer Index strategy previous peak-এর নিচে কত frequently এবং persistently ছিল তাতেও respond করে।
এ কারণে trading journal বা strategy review-তে এটি useful addition, যদি every comparison same data rule use করে এবং score-এর পাশে return, tail, liquidity ও execution measure থাকে।
Educational risk disclosure
এই tutorial The Money Man editorial workflow-এর অধীনে AI-assisted research ও writing দিয়ে প্রস্তুত করা হয়েছে। Equity value ও strategy hypothetical এবং শুধু calculation explain করতে ব্যবহার করা। এটি educational information, personalised investment advice বা performance promise নয়। Historical drawdown future loss understate করতে পারে, এবং leveraged বা illiquid position closing-price series-এর implied amount-এর চেয়ে বেশি lose করতে পারে।