Equity Curves and Underwater Charts: Read Trading Performance Properly
Last saved:
Executive Summary
- ✦An equity curve should use total marked account value and separate external deposits or withdrawals from trading returns.
- ✦An underwater chart measures each observation against the latest high-water mark.
- ✦Drawdown depth, duration and recovery shape reveal different forms of path risk.
- ✦Compare performance with an appropriate benchmark, realistic costs and pre-defined risk-review thresholds.
Equity Curves and Underwater Charts: Read Trading Performance Properly
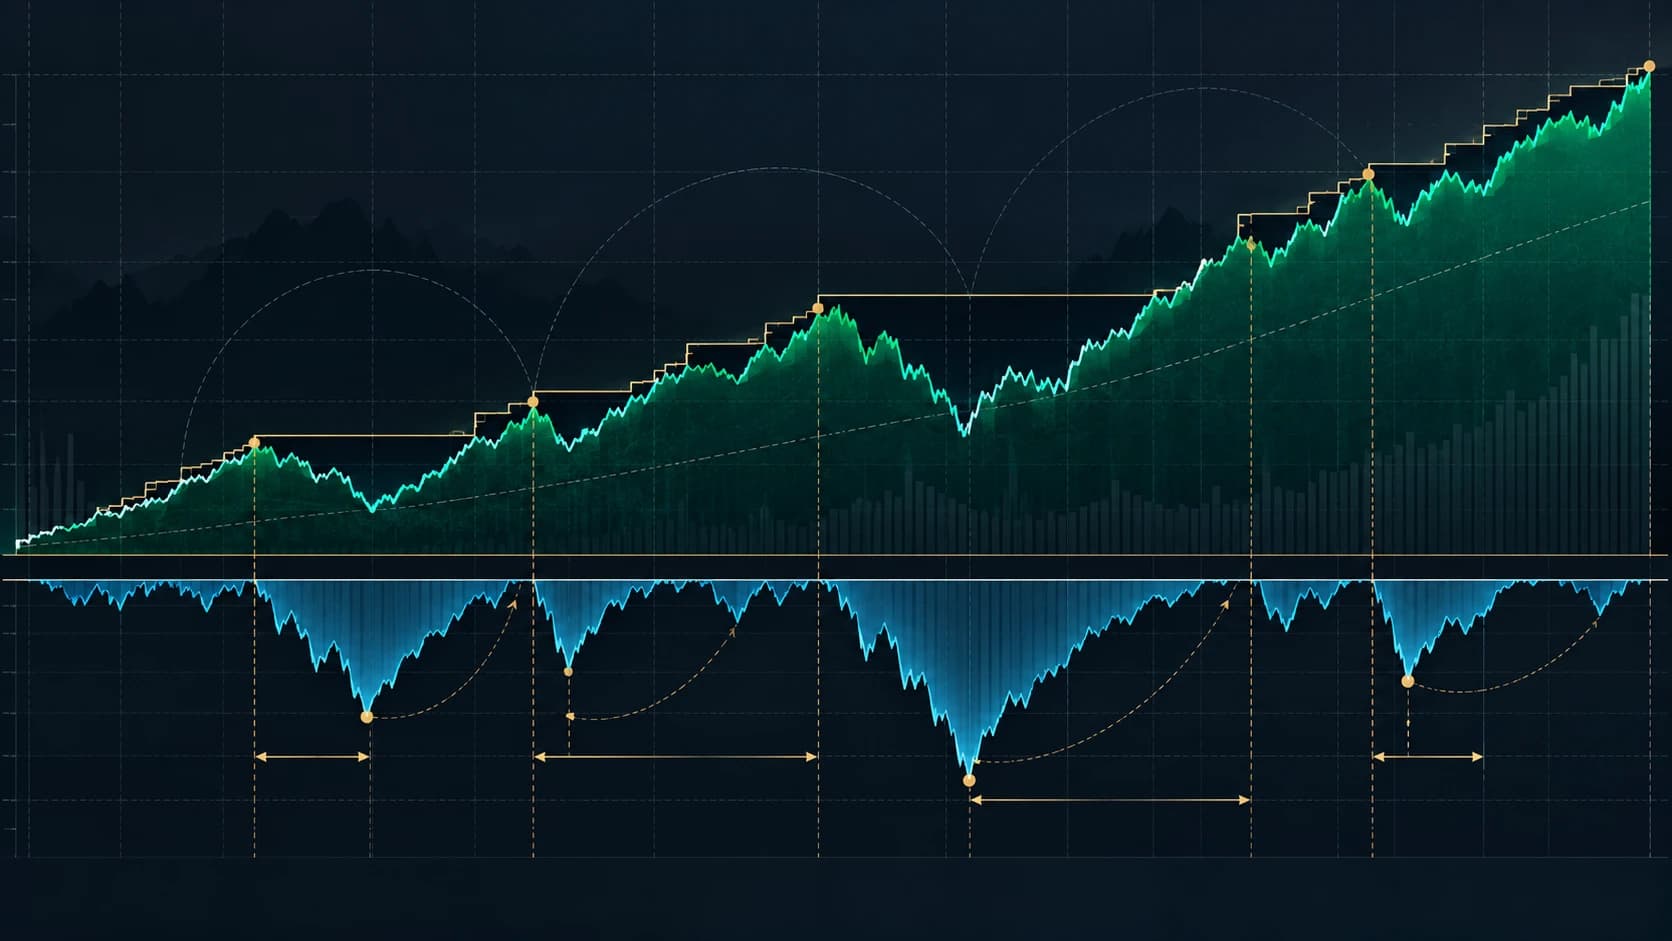
A rising account balance can hide long periods of stagnation, deep losses and dependence on one exceptional trade. An equity curve shows how account value changes through time. An underwater chart shows how far the account is below its previous peak and how long the recovery takes.
Used together, the two charts reveal the path of returns rather than just the final result. They cannot prove that a strategy will keep working, but they can expose risks that total return, win rate and average trade often conceal.
Learning objective
This tutorial explains how to:
- Build a clean equity curve from trading records.
- Calculate the high-water mark and drawdown series.
- Read drawdown depth, duration and recovery.
- Compare a strategy with its benchmark and expected risk.
- Avoid common charting choices that make performance look better than it was.
What an equity curve measures
An equity curve is a time series of the account's total value. For a live account, that normally means cash plus the marked value of open positions, minus liabilities and trading costs. For a backtest, it is the simulated portfolio value after applying the model's trades, fees and position sizing.
Choose one consistent sampling interval, such as each trading day or after every completed trade. Daily account equity is usually better for portfolio risk because it includes unrealised gains and losses. A curve made only from closed trades can appear calm while a large open loss remains hidden.
The curve should not treat deposits as trading profits or withdrawals as trading losses. If £5,000 is added to a £10,000 account, a jump to £15,000 does not represent a 50% return. External cash flows must be recorded separately or removed when calculating performance.
What an underwater chart measures
The underwater chart converts the equity curve into the percentage decline from its latest high-water mark.
For equity value E(t):
High-water mark H(t) = highest equity observed up to time t
Drawdown D(t) = E(t) ÷ H(t) − 1
At a new equity high, drawdown is 0%. Below the previous high, drawdown is negative. A value of -8% means the account is 8% below its highest earlier value.
“Underwater” is a useful visual description: the line falls below zero when the account leaves a peak and returns to zero only when that peak has been fully recovered.
Step 1: Build the data table
Use one row per chosen interval with these columns:
| Date | Starting equity | Trading P&L | Fees and financing | External cash flow | Ending equity |
|---|---|---|---|---|---|
| Day 1 | £10,000 | +£180 | -£10 | £0 | £10,170 |
| Day 2 | £10,170 | -£120 | -£10 | £0 | £10,040 |
For an open-position portfolio, mark positions using a consistent price source and time. Include commission, spread assumptions, financing and borrow costs where relevant. A backtest that ignores costs creates an equity curve for a strategy that could not have been traded on those terms.
Step 2: Calculate the running peak
The high-water mark is the largest equity value recorded so far. If the equity observations are:
£10,000 → £10,400 → £10,800 → £10,260 → £10,600
the high-water marks are:
£10,000 → £10,400 → £10,800 → £10,800 → £10,800
The peak stays at £10,800 while the account remains below it. It rises only when equity reaches a new high.
Step 3: Calculate drawdown for every observation
At £10,260, with a previous peak of £10,800:
£10,260 ÷ £10,800 − 1 = -5.00%
At £10,600:
£10,600 ÷ £10,800 − 1 = -1.85%
The loss has partly recovered, but the account is still underwater. A positive daily return does not end a drawdown; only a return to the previous high does.
Plot the drawdown percentage beneath the equity curve. The deepest point is maximum drawdown for that sample. The number of days or trades from the peak until recovery is drawdown duration.
Step 4: Read four features, not one
Direction and slope
A long-term upward curve is necessary for a profitable historical record, but a steep final section can be driven by recent leverage or one unusually favourable regime. Compare several subperiods rather than extrapolating the latest slope.
Drawdown depth
Depth shows the largest peak-to-trough loss. It affects capital survival, margin capacity and the probability that a trader abandons the process at the worst time.
Drawdown duration
Two strategies can both suffer a 10% maximum drawdown. One may recover in two weeks; the other may remain below its peak for eighteen months. The second path creates much greater opportunity cost and psychological pressure even though the headline depth is identical.
Recovery shape
A fast V-shaped recovery, a slow staircase and repeated failed recoveries represent different behaviour. The shape can suggest whether losses came from one shock, a persistent weak regime or repeated execution problems. It does not identify the cause by itself; trade-level evidence is still required.
Worked example
Consider a hypothetical strategy with this month-end equity:
| Month | Equity | High-water mark | Drawdown |
|---|---|---|---|
| January | £10,000 | £10,000 | 0.00% |
| February | £10,800 | £10,800 | 0.00% |
| March | £10,260 | £10,800 | -5.00% |
| April | £10,600 | £10,800 | -1.85% |
| May | £10,900 | £10,900 | 0.00% |
| June | £9,810 | £10,900 | -10.00% |
The equity curve ends below its starting value after June, but the chart tells a fuller story:
- The first drawdown was 5% and lasted from the February peak until the new high in May.
- April was profitable, but the strategy was still 1.85% below its high-water mark.
- June created a new maximum drawdown of 10%.
- Recovering from £9,810 to £10,900 requires an 11.11% gain, because the recovery percentage is calculated from the smaller base.
Now assume June contained a £2,000 deposit and the raw account statement ended at £11,810. If the deposit were mistaken for performance, the curve would show a false new high. After separating the cash flow, trading equity remains £9,810 and the 10% drawdown remains visible.
Step 5: Compare with a benchmark and risk budget
Plot a relevant benchmark beside the strategy, rebased to the same starting value. The aim is not merely to beat it every month. Ask whether the strategy's return compensated for leverage, turnover, illiquidity and drawdown.
A market-neutral strategy should not be judged only against a fully invested stock index. A long-only stock strategy should not claim skill for gains that simply match the market while taking greater drawdown. State the benchmark choice and why it fits the mandate.
Compare live drawdown with the range observed in out-of-sample tests, simulations and known stress periods. A historical maximum is not a safety boundary. The next drawdown can be deeper, so risk limits should include a margin of uncertainty and a written response plan.
Step 6: Investigate the shape with trade-level evidence
When the curve changes character, inspect:
- Position size and gross/net exposure.
- Asset and sector concentration.
- Average spread, slippage and fees.
- Long and short performance separately.
- Holding period and trade frequency.
- Results by setup, market regime and time of day.
- Whether one or two trades produced most of the profit.
- Whether live results differ materially from the tested distribution.
A weak curve does not automatically prove strategy decay, and a smooth rising curve does not prove robustness. The chart points to questions; the trade log supplies evidence.
Common mistakes
Showing balance instead of equity
Account balance can omit unrealised losses. Use marked total equity when the strategy carries open positions.
Ignoring deposits and withdrawals
External cash flows can create false gains or losses. Record them separately.
Using too little history
A smooth six-month curve may reflect one favourable regime. Include enough observations and multiple market conditions.
Reading only maximum drawdown
Depth without duration and recovery hides much of the lived risk.
Comparing curves with different leverage
The steeper curve may simply take more exposure. Compare return with drawdown, volatility and capital usage.
Trusting a backtest curve without execution costs
Spread, slippage, commission, financing and market impact can turn a smooth theoretical curve into an untradeable result.
Changing the strategy whenever the curve dips
Normal losing sequences happen. Define review thresholds before the drawdown begins and distinguish expected variation from evidence of a broken process.
Practical review checklist
- Does the series use total marked equity, including open positions?
- Are deposits and withdrawals separated from returns?
- Are fees, spread, slippage and financing included?
- Is the sampling interval consistent?
- What are the maximum drawdown depth and duration?
- How long did each major recovery take?
- Is performance concentrated in one trade or one market regime?
- Is the benchmark appropriate and rebased fairly?
- Does live performance remain within a pre-defined expected range?
- What action is required at each risk-review threshold?
Sources and further reading
QuantConnect's official reporting documentation defines a drawdown chart as the peak-to-trough decline of portfolio equity, and its research documentation shows how to compare the equity curve, daily returns, drawdown and benchmark. Interactive Brokers' portfolio-backtesting material illustrates why the equity curve and drawdown chart should be reviewed together.
For related risk concepts, read our guides to drawdown and recovery maths, strategy decay, R-multiples and Monte Carlo sequence risk.
This tutorial was prepared with AI-assisted research and editorial review. It is educational information, not personalised investment advice. Backtests and historical curves can understate future losses, and past performance does not guarantee future results.